. 2024 Oct 25;14(1):25323.
doi: 10.1038/s41598-024-76884-y.

Age-associated alteration of innate defensive response to a looming stimulus and brain functional connectivity pattern in mice

Affiliations

Age-associated alteration of innate defensive response to a looming stimulus and brain functional connectivity pattern in mice

Célia Bak et al. Sci Rep. .

Abstract

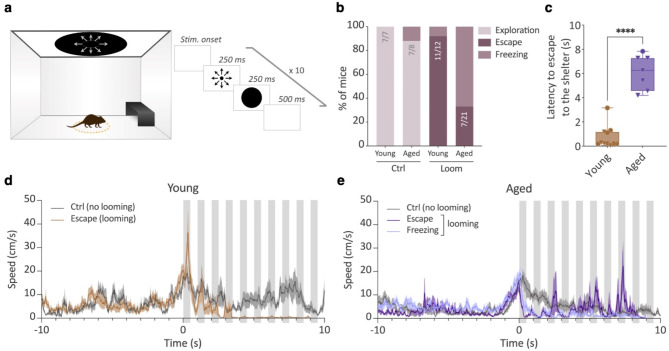
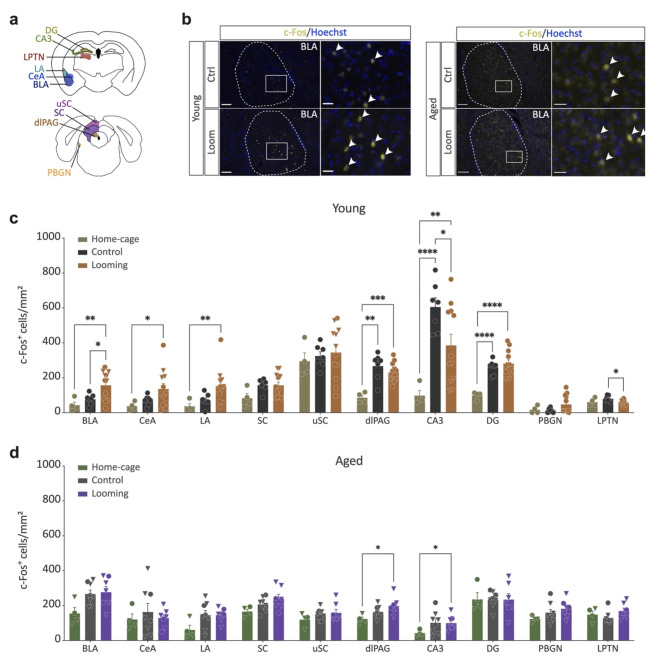
Innate defensive behaviors are essential for species survival. While these behaviors start to develop early in an individual's life, there is still much to be understood about how they evolve with advancing age. Considering that aging is often accompanied by various cognitive and physical declines, we tested the hypothesis that innate fear behaviors and underlying cerebral mechanisms are modified by aging. In our study we investigated this hypothesis by examining how aged mice respond to a looming visual threat compared to their younger counterparts. Our findings indicate that aged mice exhibit a different fear response than young mice when facing this imminent threat. Specifically, unlike young mice, aged mice tend to predominantly display freezing behavior without seeking shelter. Interestingly, this altered behavioral response in aged mice is linked to a distinct pattern of functional brain connectivity compared to young mice. Notably, our data highlights a lack of a consistent brain activation following the fear response in aged mice, suggesting that innate defensive behaviors undergo changes with aging.


Conflict of interest statement

The authors declare no competing interests.

Figures

Fig. 1
Fig. 1
Aged mice do not show robust escape behavior in response to looming stimulus. (a) Representation of the behavioral apparatus generating looming stimulus (left). The stimulus is presented when the mouse enters a virtual central zone (orange dotted circle) according to the indicated timing (right). (b) Percentage of young (3–4 months) and aged (23–25 months) mice in the “Control” (Ctrl) or “Looming” (Loom) conditions showing exploration or innate fear behavioral responses during looming stimulus. (c) Latency to escape to the shelter after stimulus onset for young (n = 11) and aged (n = 7) mice. Data are represented by the median (female and male mice are respectively represented by circles and triangles), **** p < 0.0001. Speed of young (d) and aged (e) mice in the “Control” (Ctrl, n = 7 young, n = 8 aged) or in the “Looming” (n = 12 young, n = 21 aged) groups for 10 s before (-10 to 0 s) and during (0 to 10 s) the stimulus. The performance of young and aged control mice is centered on their entry into the virtual central zone, even though the stimulus was not displayed for them. The performance of aged mice is displayed in 2 groups: animals showing only a freezing response (no escape behavior) (light purple, n = 14) and those showing both escape and freezing behavior (dark purple, n = 7). Each gray bar represents a looming stimulus, as shown in a. Data are represented as mean ± SEM.
Fig. 2
Fig. 2
C-Fos expression in various brain regions in response to looming stimulus in young and aged mice. (a) Schematic representation of brain structures selected for c-Fos immunohistochemistry analysis [Bregma − 1,82 (top) and − 4,16 mm (bottom)]. (b) Photomicrographs of brain sections following c-Fos immunohistochemistry and counterstaining with Hoechst. Arrows indicate the presence of c-Fos immunolabeled (c-Fos+) cells in the BLA of control (Ctrl) and looming (Loom) animals (scale bars = 100 μm/25 µm). Density analysis of c-Fos+ cells in the dentate gyrus (DG) and the CA3 region of the dorsal hippocampus, the basolateral (BLA), central (CeA) and lateral (LA) amygdala, the lateral posterior thalamic nucleus (LPTN), the superior colliculus (SC) and its upper layers (uSC), the dorsolateral periaqueductal gray (dlPAG) and the parabigeminal nucleus (PBGN) of (c) young mice in the “Home-Cage” (n = 4), “Control” (n = 7) and “Looming” (n = 12) conditions and (d) aged mice in the “Home-Cage” (n = 4), “Control” (n = 8) and “Looming” (n = 7) groups (female and male are represented by circles and triangles, respectively). Data are represented as mean ± SEM ; *p < 0.05, **p < 0.01, ***p < 0.001, ****p < 0.0001 by Tukey’s post-hoc tests.
Fig. 3
Fig. 3
Correlation matrices and functional brain connectivity networks recruited by looming stimulus in young mice. (a) Correlational analysis of c-Fos expression between brain regions of young animals in «Home-Cage», «Control» and «Looming» groups. The color of each box depicts Pearson’s correlation coefficient (r values range from − 1 to 1) according to the brain regions being compared. *p < 0.05, **p < 0.01. (b) The network representations for each correlation matrix show only significant positive (solid black lines) or negative (dashed gray lines) correlations. Each brain structure is plotted as a circle with a size representing the fold change in c-Fos+ cell density between experimental (Control and Looming) and Home-Cage conditions. Thickness of the link represents the r value of the correlation. LA (lateral amygdala), CeA (central amygdala), BLA (basolateral amygdala), LPTN (lateral posterior thalamic nucleus), PBGN (parabigeminal nucleus), DG (dentate gyrus of the dorsal hippocampus), CA3 (CA3 region of the dorsal hippocampus), dlPAG (dorsolateral periaqueductal gray), uSC (upper layers of superior colliculus), SC (superior colliculus).
Fig. 4
Fig. 4
Correlation matrices and functional brain connectivity networks recruited by looming stimulus in aged mice. (a) Correlational analysis of c-Fos expression between brain regions of aged mice in «Home-Cage», «Control» and «Looming» groups. The color of each box depicts the Pearson correlation coefficient (ranging from − 1 to 1) according to the brain regions being compared. (b) The network representations for each correlation matrix only show significant correlations. Each brain structure is plotted as a circle with a size representing the fold change in c-Fos+ cell density between experimental (Control and Looming) and Home-Cage conditions. LA (lateral amygdala), CeA (central amygdala), BLA (basolateral amygdala), LPTN (lateral posterior thalamic nucleus), PBGN (parabigeminal nucleus), DG (dentate gyrus of the dorsal hippocampus), CA3 (CA3 region of the dorsal hippocampus), dlPAG (dorsolateral periaqueductal gray), uSC (upper layers of superior colliculus), SC (superior colliculus).

Similar articles

References

    1. Hennig, C. W., Dunlap, W. P. & Gallup, G. G. The effect of distance between predator and prey and the opportunity to escape on tonic immobility in Anolis Carolinensis. Psychol. Rec.26, 312–320 (1976).
    1. Dill, L. M. & Houtman, R. The influence of distance to refuge on flight initiation distance in the gray squirrel (Sciurus carolinensis). Can. J. Zool.67, 233–235 (1989).
    1. Liden, W. H., Phillips, M. L. & Herberholz, J. Neural control of behavioural choice in juvenile crayfish. Proc. R. Soc. B.277, 3493–3500 (2010). - PMC - PubMed
    1. Domenici, P. Context-dependent variability in the components of fish escape response: Integrating locomotor performance and behavior. J. Exp. Zool.313A, 59–79 (2010). - PubMed
    1. Temizer, I., Donovan, J. C., Baier, H. & Semmelhack, J. L. A visual pathway for looming-evoked escape in larval zebrafish. Curr. Biol.25, 1823–1834 (2015). - PubMed

LinkOut - more resources