. 2024 Nov;25(11):2110-2123.
doi: 10.1038/s41590-024-01992-w. Epub 2024 Oct 25.

Immunotherapy response induces divergent tertiary lymphoid structure morphologies in hepatocellular carcinoma

Affiliations

Immunotherapy response induces divergent tertiary lymphoid structure morphologies in hepatocellular carcinoma

Daniel H Shu et al. Nat Immunol. 2024 Nov.

Abstract

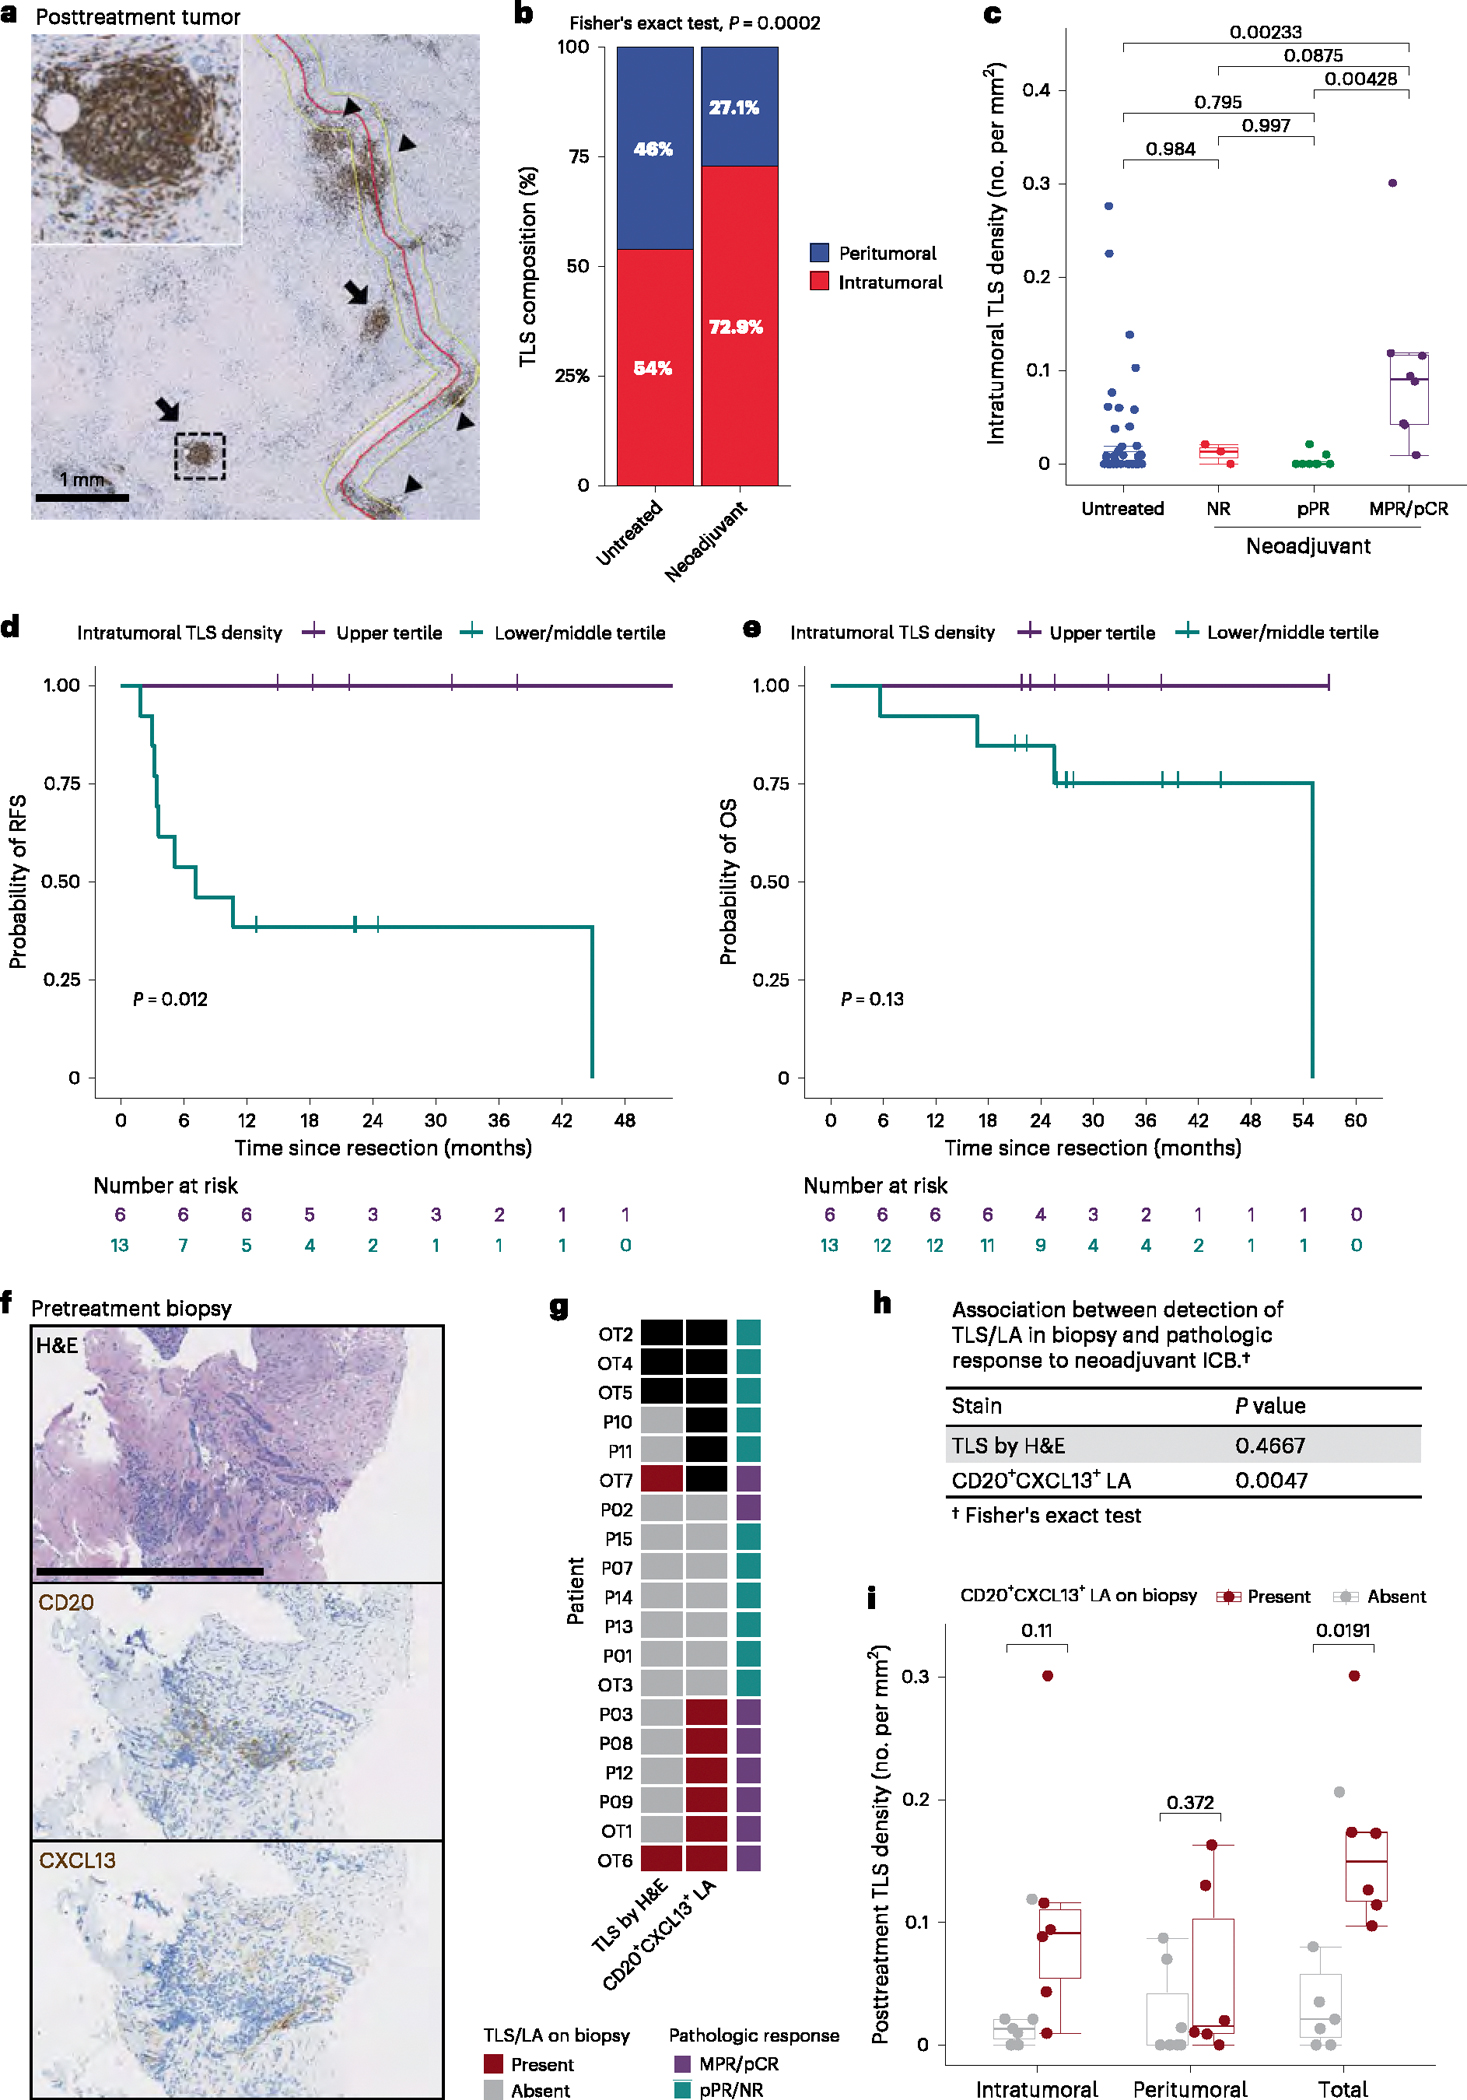
Tertiary lymphoid structures (TLS) are associated with improved response in solid tumors treated with immune checkpoint blockade, but understanding of the prognostic and predictive value of TLS and the circumstances of their resolution is incomplete. Here we show that in hepatocellular carcinoma treated with neoadjuvant immunotherapy, high intratumoral TLS density at the time of surgery is associated with pathologic response and improved relapse-free survival. In areas of tumor regression, we identify a noncanonical involuted morphology of TLS marked by dispersion of the B cell follicle, persistence of a T cell zone enriched for T cell-mature dendritic cell interactions and increased expression of T cell memory markers. Collectively, these data suggest that TLS can serve as both a prognostic and predictive marker of response to immunotherapy in hepatocellular carcinoma and that late-stage TLS may support T cell memory formation after elimination of a viable tumor.


Conflict of interest statement

Competing interests

M.Y. reports consulting fees from Astra Zeneca, Exelixis, Genentech, Replimune, Hepion, Lantheus; research funding (to Johns Hopkins) from Bristol-Myers Squibb, Exelixis, Incyte and Genentech; and is a co-founder with equity of Adventris Pharmaceuticals. E.J.F. is on the Scientific Advisory Board of Viosera/Resistance Bio, is a paid consultant for Merck and Mestag Therapeutics, and receives research funds from Abbvie. W.J.H. has received patent royalties from Rodeo/Amgen and is the recipient of grants from Sanofi, NeoTX, and CirclePharma. He has received speaking/travel honoraria from Exelixis and Standard BioTools. E.M.J. reports grant/research support from the Lustgarten Foundation, Break Through Cancer, Roche/Genentech, Bristol-Meyers Squibb; honoraria from Achilles, DragonFly, Parker Institute, Cancer Prevention and Research Institute of Texas, Surge, HDT Bio, Mestag Therapeutics, Medical Home Group; and equity in AbMeta Therapeutics and Adventris Pharmaceuticals. D.J.Z. reports grant/research support from Roche/Genentech. R.J.J. is an employee and stockholder of Roche/Genentech. J.M.T. reports research funding from BMS and Akoya Biosciences; serves as a consultant for BMS, Merck, Astra Zeneca, Genentech, Regeneron, Elephas, Lunaphore, Compugen, and Akoya Biosciences; and holds stock in Akoya Biosciences. The remaining authors declare no competing interests.

Figures

Extended Data Fig. 1 |
Extended Data Fig. 1 |. TLS density in HCC tumors treated with neoadjuvant ICB compared to untreated controls.
a, TLS composition according to location in untreated (n = 52) and neoadjuvant ICB (n = 19) treated HCC tumors. Tumors found to have no TLS are not shown. b, Box-and-whisker plots showing total, peritumoral, and intratumoral TLS density in patients with locally advanced HCC treated with neoadjuvant ICB and untreated controls. c, Representative images of a single TLS in formalin-fixed, paraffin embedded (FFPE) HCC tumor stained with hematoxylin and eosin (H&E) and anti-CD3, CD8, CD20, CD56, and CXCL13. Scale bar, 250 μm. d, Comparison of cell density of CD+, CD+, CD20+, CD56+ positive cells and percent area of CXCL13+ tissue in untreated and neoadjuvant ICB-treated HCC tumors. e, Proportion of untreated and neoadjuvant ICB-treated HCC tumors found to have TLS according to non-viral or viral HCC etiology. f, Total, peritumoral, and intratumoral TLS density in untreated and neoadjuvant ICB-treated HCC tumors according to non-viral or viral HCC etiology. g-h, Box-and-whisker plots showing total (g) and peritumoral TLS density (h) according to pathologic response. NR, non-response. pPR, partial pathologic response. MPR/pCR, major pathologic response or complete response. Statistical significance was determined by two-tailed t-test (b, d, and f), Fisher’s exact test (e), and one-way ANOVA followed by Tukey’s honest significant difference (HSD) test (g and h). For each box-and-whisker plot, the horizontal bar indicates the median, the upper and lower limits of the boxes the interquartile range, and the ends of the whiskers 1.5 times the interquartile range.
Extended Data Fig. 2 |
Extended Data Fig. 2 |. Relapse free survival and overall survival in HCC treated with neoadjuvant ICB, according to clinical covariates.
a-l, Kaplan-Meier curves showing relapse free survival and overall survival after surgical resection for HCC patients treated with neoadjuvant ICB, according to total TLS density (a and b), peritumoral TLS density (c and d), pathologic response (e and f), prior hepatitis C(HCV) infection (g and h), prior hepatitis B (HBV) infection (i and j), and presence or absence of CD20+CXCL13+ lymphoid aggregates in pre-treatment biopsy (k and I). Statistical significance was determined by log-rank test.
Extended Data Fig. 3 |
Extended Data Fig. 3 |. Pretreatment single marker immunohistochemistry compared to posttreatment cell density and TLS density.
a, Line plots showing density of CD3, CD8, CD20, CD56 positive cells, and percent area of tissue positive for CXCL13 in pretreatment biopsy and post-neoadjuvant ICB HCC tumors. b, Dotplots showing correlation between post-treatment TLS density and pretreatment density of CD3, CD8, CD20, CD56 positive cells, and percent area of tissue positive for CXCL13 tissue. Statistical significance was determined by two-tailed t-test (a) and Pearson’s correlation (b).
Extended Data Fig. 4 |
Extended Data Fig. 4 |. High TLS density is associated with increased T and B cell activation.
a, Principal component analysis of bulk RNA sequencing data from HCC tumors resected after neoadjuvant ICB (n = 12) assigned to high (n = 5) and low (n = 7) TLS density groups. b, Heatmap showing differentially expressed genes (DEGs) with a log2 fold change (log2FC) > 1 and adjusted P value < 0.05 between tumors with TLS high and low groups. Annotation rows indicate TLS density group, HCC etiology, neoadjuvant treatment, pathologic response, relapse status, and TLS density. Annotation columns at right identify DEGs belonging to Gene Oncology Biological Pathways gene sets for T cell activation, B cell activation, Cytokine production, and Dendritic Cell Antigen Processing and Presentation. c, Volcano plot showing differentially expressed genes between tumors with high and low TLS density. Vertical dotted lines represent log2FC greater than or less than 1. Horizontal dotted line indicates adjusted P value of 0.05. 4 outlier genes with the lowest log2FC are excluded from the plot for the purposes of visualization. d, Gene set enrichment analysis showing differentially enriched gene sets from the HALLMARK database between tumors with high and low TLS density. e, Heatmap showing expression of the 12-chemokine TLS gene signature in TLS high and low tumors.
Extended Data Fig. 5 |
Extended Data Fig. 5 |. Identification of divergent TLS morphologies in viable tumor and tumor regression bed by immunohistochemistry and imaging mass cytometry.
a, Serial FFPE tissue sections from the tumor of patient OT7 showing multiple involuted TLS. Images show staining with hematoxylin and eosin (left) and immunohistochemistry staining for CD20 and Ki67 (top right), CD3 and CD21 (middle right), and CD4 and CD8 (bottom right). Scale bar, 500 μm. b, Serial FFPE sections of a single involuted TLS from the tumor of patient OT7 stained with anti-CD20 antibody (brown). Numbers indicate the order in which the sections were cut from the tissue block. Scale bar, 250 μm. c-d, Dot plots showing representative mature (c) and involuted (d) TLS, colored according to cluster assignment of individual cells after cell segmentation. e, Box-and-whisker plots showing cell cluster density in mature versus involuted TLS for CXCR3low CD4T cells, CD57+ CD4 T cells, Macrophages, and Stroma. f, Box-and-whisker plots showing comparison of cell cluster density in mature TLS by location (intratumoral versus peritumoral). g, HLA-DR expression in the tumor cluster, by TLS morphology. Statistical significance was determined by pairwise two sample Wilcoxon test (f-g). For each box-and-whisker plot, the horizontal bar indicates the median, the upper and lower limits of the boxes the interquartile range, and the ends of the whiskers 1.5 times the interquartile range.
Extended Data Fig. 6 |
Extended Data Fig. 6 |. T and B cell clonal dynamics of TLS.
a, Representative images showing method of identification and microdissection of individual TLS. Image on left shows HCC tumor stained with hematoxylin and eosin (H&E) at low magnification. Insets show higher magnification of staining with H&E, anti-CD20 (magenta) and anti-Ki67 (brown), anti-CD3 (magenta) and anti-CD21 (brown), anti-CD4 and anti-CD8 (bottom right), and corresponding pre- and post-microdissection images. Scale bar, 1mm. b-c, Total number of T cell receptor beta chain (TCRβ) (b) and immunoglobulin heavy chain (IGH) (c) clones identified in microdissected TLS. d, Box-and-whisker plot comparing the percentage of the TCRβ or IGH repertoire of each TLS that is shared with other TLS from the same tumor, by location. e-f, Dotplots showing TCRβ (e) and IGH (f) repertoire clonality (as determined by Normalized Shannon Entropy) for matched mature and involuted TLS. g, Violin plots comparing number of IGH V gene substitutions in mature and involuted TLS, by patient. Individual data points (not shown) represent individual IGH sequences. Statistical significance was determined by one-way ANOVA followed by Tukey’s honest significant difference(HSD) test (d) and two-tailed t test (e-g). For each box-and-whisker plot, the horizontal bar indicates the median, the upper and lower limits of the boxes the interquartile range, and the ends of the whiskers 1.5 times the interquartile range. For each violin plot, the horizontal bar indicates the median and the upper and lower limits of the boxes the interquartile range.
Extended Data Fig. 7 |
Extended Data Fig. 7 |. T and B cell clonal dynamics of TLS, peripheral blood, and tumor draining lymph nodes.
a-b, Proportion of unique T cell receptor beta chain (TCRβ) clonotypes at each TLS that were also detected in matched post-treatment (a) and pre-treatment (b) peripheral blood from patients P02, P03, P07, P08, and P12. c-d, Proportion of unique TCRβ (c) and Immunoglobulin Heavy Chain (IGH) (d) clonotypes at each TLS that were identified in the TDLN of patients OT1 and OT6. e-f, Representative upset plots showing overlap in unique TCRβ (e) and IGH (f) between tumor draining lymph node (TDLN) and microdissected TLS for patient OT1. Bottom barplots and annotation row indicate number of overlapping clonotypes between different TLS repertoires. Top stacked barplots indicate clonal composition. Bottom right stacked barplots indicate total number of unique TCRβ or IGH clonotypes identified and overall clonal composition.
Extended Data Fig. 8 |
Extended Data Fig. 8 |. Single cell gene expression and T cell receptor (TCR) repertoire characteristics of post-treatment peripheral blood.
a, UMAPs showing gene expression of CD3E, CD4, CD8A, CCR7, SELL, GZMK, PDCD1, CXCL13, TOX, and ZNF683 across all single cells sequenced from post-treatment peripheral blood of 7 HCC patients treated with neoadjuvant ICB. b, Heatmap showing gene expression of the top 3 differentially expressed genes per cluster. Rows represent single genes and columns represent individual cells. Annotation bar indicates cluster identity, whether each cell had a sequenced TCR, the clonality of the TCR, and whether the TCR was identified in microdissected TLS from the same patient. Clusters were downsampled to 75 cells per cluster for visualization. c-e, Volcano plots showing differentially expressed genes in the CD8 TEM_GZMK (c), CD8 TEM_GZMB (d), and CD4 Tph (e) clusters compared to all other cells. Vertical dotted lines indicate a fold change of greater or less than 1.4 and horizontal line indicates a P value of 0.05. Labeled genes in c and d indicate genes with the highest differential expression. Labeled genes in e indicate genes known to be highly expressed in CD4 Tph.
Extended Data Fig. 9 |
Extended Data Fig. 9 |. Single cell gene expression and T cell receptor (TCR) repertoire characteristics of post-treatment tumor infiltrating lymphocytes from patient OT6.
a, Uniform Manifold Approximation and Projection (UMAP) for 562 T cells identified by single-cell sequencing of CD3+CD19+ FACS-sorted tumor infiltrating lymphocytes. B cells excluded from analysis. b, Barplot showing number of single cells per cluster. c, Violin plots showing expression of subset specific marker genes across clusters. d, UMAP showing clonality of tumor infiltrating lymphocytes according to T cell receptor beta chain (TCRβ) sequence. e, Heatmap showing gene expression of the top 3 differentially expressed genes per cluster. Rows represent single genes and columns represent individual cells. Annotation bar indicates cluster identity, whether each cell had a sequenced TCR, the clonality of the TCR, and whether the TCR was identified in microdissected TLS from the same patient. f-h, Volcano plots showing differentially expressed genes in the CD8 TEM_GZMK (f), CD8 TEM_GZMB (g), and CD4 Tph (h) clusters compared to all other cells. Vertical dotted lines indicate a fold change of greater or less than 1.4 and horizontal line indicates a P value of 0.05.
Extended Data Fig. 10 |
Extended Data Fig. 10 |. Single cell gene expression and T cell receptor (TCR) repertoire characteristics of tumor infiltrating lymphocytes identified in TLS of patient OT6.
a, UMAP showing T cells identified by single cell sequencing whose T cell receptor beta chain (TCRβ) sequence was also identified in microdissected TLS. b, Stacked barplot showing proportion of each single cell cluster identified in TLS. c, Inferred transcriptional phenotype of the top 15 TCRβ clonotypes in mature and involuted TLS of patient OT6. d, Single cell cluster identities of shared TCRβ according to unique CDR3 and compartment where the TCR was identified. Piecharts are colored according to the cluster identities of all cells with the same TCRβ. The radius of each piechart is proportional to the total number of cells in which each TCRβ was identified (square root of n cells divided by eight).
Fig. 1 |
Fig. 1 |. TLS correlate with clinical benefit in HCC treated with neoadjuvant immunotherapy.
a, Representative images of FFPE HCC tumors stained with anti-CD20 antibody. Annotations indicate boundary between tumor/tumor regression bed and adjacent normal parenchyma (red), extension of boundary by 200 μm (yellow), intratumoral TLS (arrow) and peritumoral TLS (arrow head). The inset shows representative TLS at high magnification. Scale bar, 1 mm. b, A bar plot showing the overall composition of TLS by location in untreated controls and neoadjuvant ICB-treated tumors. c, Box-and-whisker plots showing intratumoral TLS density in untreated (n = 52) and neoadjuvant treated tumors, divided according to pathologic response (n = 19). d,e, Kaplan-Meier curves showing RFS (d) and OS (e) for patients in the neoadjuvant ICB-treated cohort in the highest tertile of intratumoral TLS density (purple) compared with the middle and lowest tertiles (green).f, Representative images of a FFPE fine needle biopsy from an HCC tumor before neoadjuvant immunotherapy. The images show staining with H&E, anti-CD20 and anti-CXCL13 antibodies. g, A heat map showing detection of TLS by H&E in pretreatment biopsies compared with detection of CD20+CXCL13+ lymphoid aggregates (LAs). The black squares indicate cases where samples were not available either due to lack of biopsy or insufficient tissue. The annotation bar indicates subsequent pathologic response to neoadjuvant ICB for each patient. h, The association between detection of TLS by H&E or CD20+CXCL13+ LA in pretreatment biopsy and subsequent pathologic response after neoadjuvant ICB. i, Box-and-whisker plots showing intratumoral, peritumoral and total TLS density after neoadjuvant ICB in patients with evaluable biopsy, divided according to the presence or absence of CD20+CXCL13+ LAs on pretreatment biopsy. Statistical significance was determined by one-way analysis of variance followed by Tukey’s honest significant difference test (c), Fisher’s exact test (b and h), log-rank test (d and e) and two-tailed t-test (i). For each box-and-whisker plot, the horizontal bar indicates the median, the upper and lower limits of the boxes the interquartile range and the ends of the whiskers 1.5 times the interquartile range.
Fig. 2 |
Fig. 2 |. Involuted TLS are present in areas of tumor regression.
a, A representative FFPE neoadjuvant ICB-treated tumor stained with H&E showing divergent TLS morphologies (‘mature’ and ‘involuted’) in viable residual viable tumor and regression bed. The dotted line shows the boundary between residual viable tumor and regression bed. The blue arrows indicate mature TLS and red arrows indicate involuted TLS. Higher-magnification images of representative mature and involuted TLS are shown on the right with serial sections stained with dual immunohistochemistry for CD20 (magenta) and Ki67 (brown), CD3 (magenta) and CD21 (brown), and CD4 (magenta) and CD8 (brown). Scale bars, 2.5 mm for the low-magnification image and 250 μm for the high-magnification image. b, Imaging mass cytometry (IMC) workflow. c,d, Representative images of mature (c) and involuted (d) TLS obtained by IMC. The insets show higher-magnification images of CD8+ T cells trafficking through HEVs (c, far left), an extensive CD21+CD23+FDC network in the mature morphology (c, middle left) compared with scant CD21+ and CD23+ in the involuted morphology (d, middle left), close interactions between T cells and DCLAMP+ mature dendritic cells (MDCs) in the T cell zone adjacent to the germinal center (c, middle right), and high podoplanin expression in the germinal center of the mature TLS (c, far right). Scale bars, 100 μm. SMA, smooth muscle actin; CK, cytokeratin. e, A heat map showing the average IMC marker expression in annotated cell clusters identified from 90,344 single cells from 38 TLS (n = 20 mature and n = 18 involuted).f, The composition of mature and involuted TLS regions by cell type as a percentage of total cells per TLS.
Fig. 3 |
Fig. 3 |. Involuted TLS display persistence of the T cell zone.
a, Box-and-whisker plots showing cell cluster density in mature versus involuted TLS. For each box-and-whisker plot, the horizontal bar indicates the median, the upper and lower limits of the boxes the interquartile range, and the ends of the whiskers 1.5 times the interquartile range. b, Nearest neighbor analysis with rows indicating individual clusters in mature and involuted TLS and columns corresponding to first and second most common neighbors. c, Network analysis for cell clusters in mature and involuted TLS. The node size corresponds to the proportion of total cells for each TLS type occupied by each cluster. The edge length represents the shortest distance between cell clusters and the thickness corresponds to the number of measurements for each TLS type. d, Violin plots showing expression of CD45RO, CD25, CD69, CD137, LAG3, PD1 and TOX in the Tc and Tph clusters and CD11c, CCR7, DCLAMP, HLA-DR and CD86 in the MDC cluster, according to TLS morphology. Statistical significance was determined by pairwise two sample Wilcoxontest (a and d).
Fig. 4 |
Fig. 4 |. Immune repertoire overlap at TLS is greater for T cells than B cells.
a, The workflow for T and B cell repertoire profiling of microdissected TLS (n = 30 mature and 5 involuted) from seven patients. b,d, Upset plots showing the overlap in unique TCR-β (b) and IGH (d) clonotypes across microdissected TLS from the same patient (P02). The bar plots in gray and annotation row indicate distinct groups of clonotypes shared between different TLS. The top stacked bar plots indicate the composition of groups according to clonal expansion. The bottom right stacked bar plots indicate the total unique TCR-β or IGH clonotypes identified at each TLS according to degree of clonal expansion. c,e, Alluvial plots tracking the top ten TCR-β (c) or IGH (e) clonotypes from TLS 1 of patient P02 across all TLS microdissected from the patient’s tumor. f, A box-and-whisker plot comparing the percentage of the TCR-β or IGH repertoire of each TLS that is shared with other TLS from the same tumor. g, A box-and-whisker plot comparing TCR-β clonality (as determined by normalized Shannon entropy) in microdissected mature and involuted TLS. Each point represents the TCR-β of an individual TLS. h, A violin plot comparing the number of IGH V gene substitutions in mature and involuted TLS. The individual data points (not shown) represent individual IGH sequences. Statistical significance was determined by two-tailed t-tests (fh).
Fig. 5 |
Fig. 5 |. GZMK+ and GZMB+CD8+ T cells are highly represented in TLS.
a, Uniform Manifold Approximation and Projection (UMAP) of 23,172 T cells identified by single-cell RNA/TCR/BCR sequencing of CD3+CD19+ FACS-sorted peripheral blood from patients with HCC treated with neoadjuvant ICB (n = 7). b, A bar plot showing the number of single cells per cluster. c, Violin plots showing expression of a subset of specific marker genes across clusters. d,e, UMAPs showing clonality of single cells with an associated T cell receptor sequence (d) and single cells with a TCR-β identified in microdissected TLS (e). f, A bar plot showing the proportion of each single-cell cluster identified in TLS. g, The inferred transcriptional phenotype of TCR-β clonotypes in microdissected TLS with a matching TCR-β in single-cell sequencing of posttreatment peripheral blood (n = 7) or TILs (n = 1). h, The inferred transcriptional phenotype of TCR-β clonotypes in mature and resolving TLS of patient OT6.
Fig. 6 |
Fig. 6 |. Involuted TLS are found in regression beds of other tumors types treated with neoadjuvant ICB.
a, A representative image of a FFPE tumor from a patient with lung adenocarcinoma who had pCR after neoadjuvant anti-PD-1 plus anti-CTLA4 stained with anti-CD20 antibody (left) and high magnification images (right) of staining for CD20, CD3 (magenta) and CD21 (brown), CD4 (magenta) and CD8 (brown), DCLAMP and HLA-DR. The dotted line indicates the boundary between tumor regression bed and adjacent normal tissue or lymph node. Mature TLS (blue arrows) are found predominantly within the adjacent normal tissue at the interface with the tumor regression bed, and involuted TLS (red arrows) are found within regression bed. Scale bars, 2.5 mm for the low-magnification image and 500 μm for high-magnification images. b, Box-and-whisker plots showing cell density for CD20−, CD21−, CD3−, CD4−, CD8−, DCLAMP- and HLA-DR-positive cells in mature (n = 30) and involuted (n = 22) TLS in two lung adenocarcinoma tumors where involuted TLS were identified. Statistical significance was determined by two-tailed t-tests. c, A multiplex immunofluorescence image showing CD3 (red) and CD79a (green) staining in involuted TLS identified in the tumor regression bed of a MCC tumor with pCR after neoadjuvant anti-PD-1. Scale bar, 600 μm.
Fig. 7 |
Fig. 7 |. Comparison of mature TLS in areas of viable tumor and involuted TLS in the tumor regression bed.
Mature TLS in viable tumor display a highly organized germinal center (GC) with close interactions between GC B cells and CD21+ FDCs, a T cell zone characterized by CD4+ Tph cells in close proximity to MDCs and cytotoxic CD8+ T cells trafficking to the tumor via HEVs. In areas of tumor regression, an involuted TLS morphology is found that displays dissolution of the GC and persistence of Tph–DC interactions in the T cell zone, increased T cell memory marker expression and clonal expansion of cytotoxic and tissue resident memory CD8+ T cells. Created with Biorender.com.

References

    1. Chalabi M et al. Neoadjuvant immunotherapy leads to pathological responses in MMR-proficient and MMR-deficient early-stage colon cancers. Nat. Med. 26, 566–576 (2020). - PubMed
    1. Ho WJ et al. Neoadjuvant cabozantinib and nivolumab convert locally advanced hepatocellular carcinoma into resectable disease with enhanced antitumor immunity. Nat. Cancer 10.1038/s43018-021-00234-4 (2021). - DOI - PMC - PubMed
    1. Cabrita R et al. Tertiary lymphoid structures improve immunotherapy and survival in melanoma. Nature 577, 561–565 (2020). - PubMed
    1. Helmink BA et al. B cells and tertiary lymphoid structures promote immunotherapy response. Nature 577, 549–555 (2020). - PMC - PubMed
    1. Petitprez F et al. B cells are associated with survival and immunotherapy response in sarcoma. Nature 577, 556–560 (2020). - PubMed

MeSH terms

Substances

LinkOut - more resources