

FMT and TCM to treat diarrhoeal irritable bowel syndrome with induced spleen deficiency syndrome- microbiomic and metabolomic insights
- PMID: 39455910
- PMCID: PMC11515126
- DOI: 10.1186/s12866-024-03592-y
FMT and TCM to treat diarrhoeal irritable bowel syndrome with induced spleen deficiency syndrome- microbiomic and metabolomic insights
Abstract
Background: Diarrheal irritable bowel syndrome (IBS-D) is a functional bowel disease with diarrhea, and can be associated with common spleen deficiency syndrome of the prevelent traditional Chinese medicine (TCM) syndrome. Fecal microbiota transplantation (FMT) could help treating IBS-D, but may provide variable effects. Our study evaluated the efficacy of TCM- shenling Baizhu decoction and FMT in treating IBS-D with spleen deficiency syndrome, with significant implications on gut microbiome and serum metabolites.
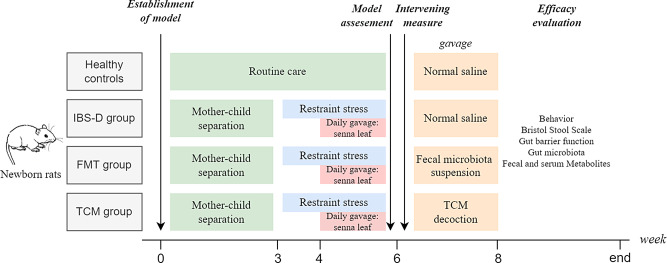
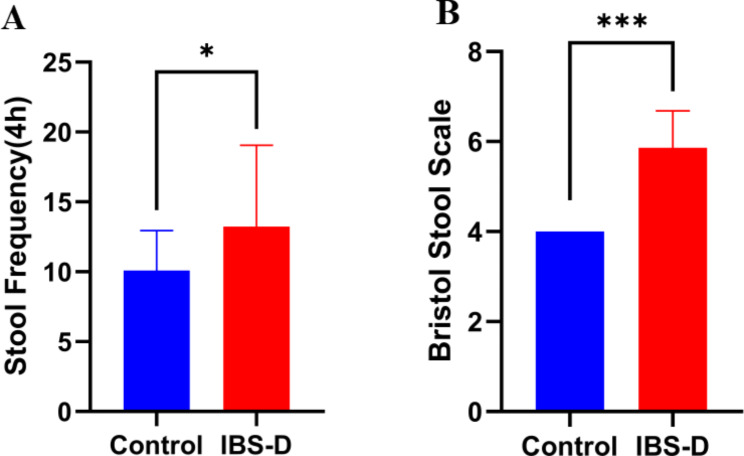
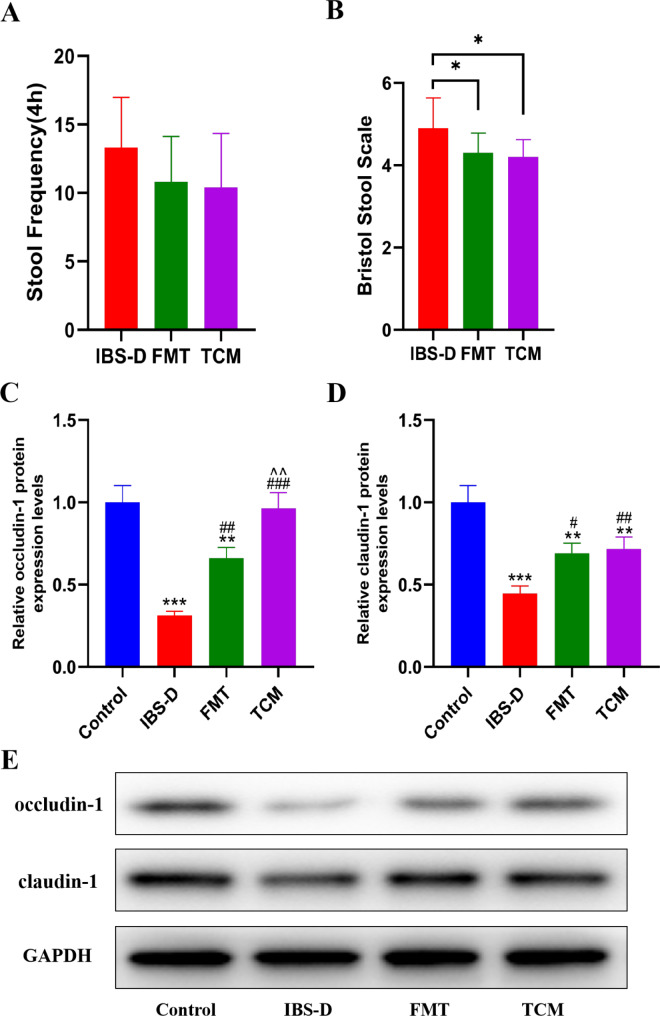
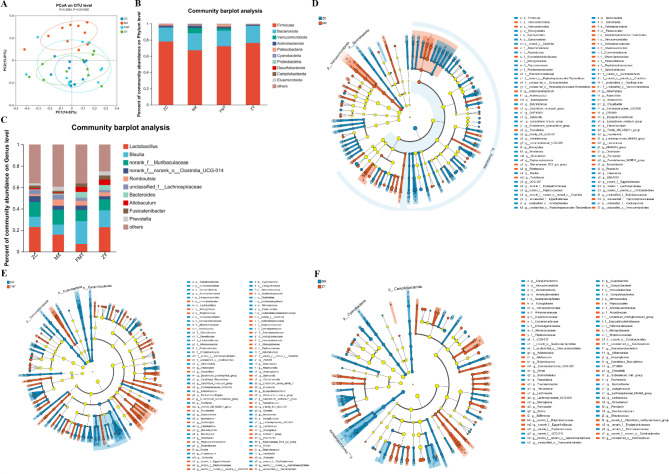
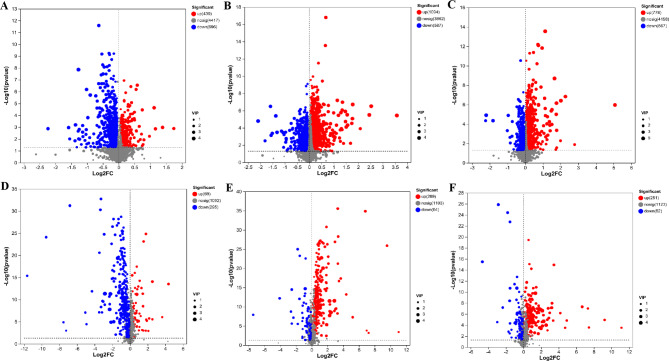
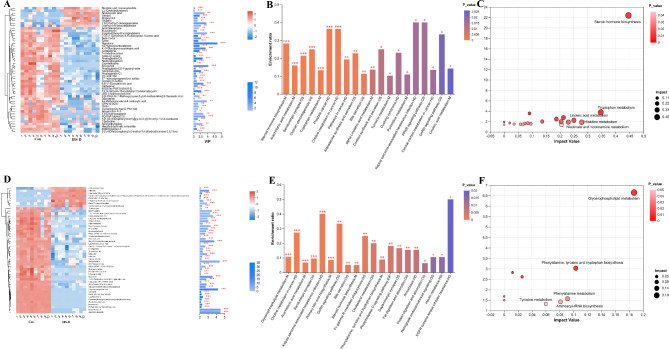
Methods: The new borne rats were procured from SPF facility and separated as healthy (1 group) and IBS-D model ( 3 groups) rats were prepared articially using mother's separation and senna leaf treatment. 2 groups of IBS-D models were further treated with TCM- shenling Baizhu decoction and FMT. The efficacy was evaluated by defecation frequency, bristol stool score, and intestinal tight junction proteins (occludin-1 and claudin-1) expression. Microbiomic analysis was conducted using 16 S rRNA sequencing and bioinformatics tools. Metabolomics were detected in sera of rats by LC-MS and annotated by using KEGG database.
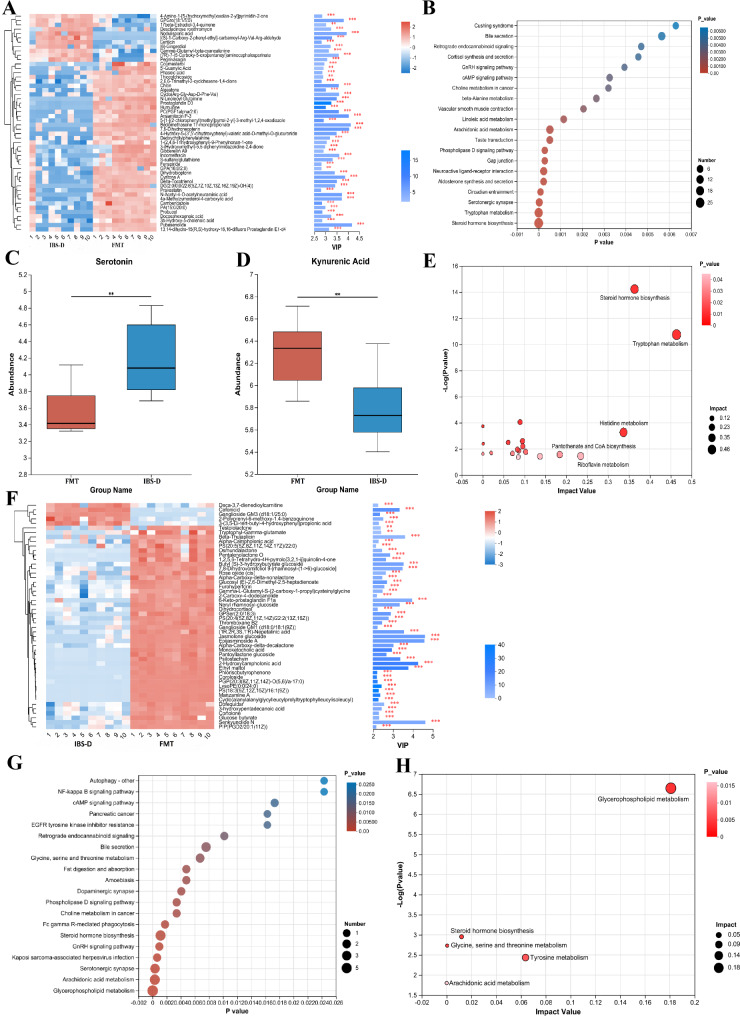
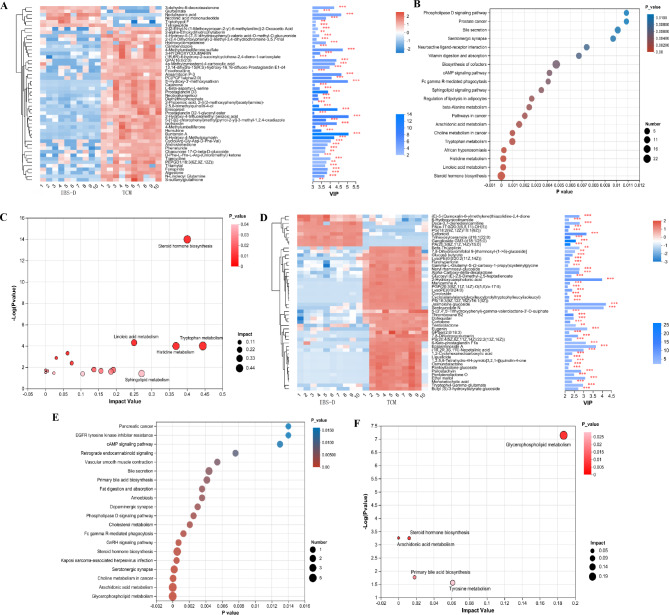
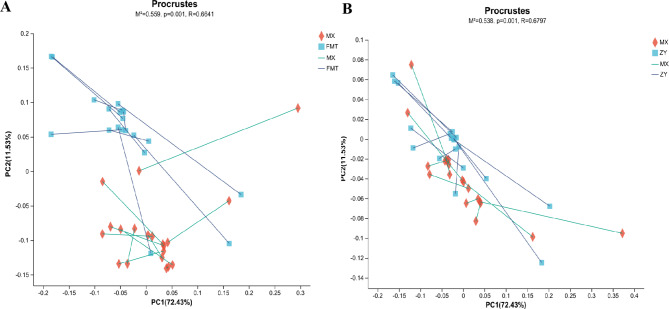
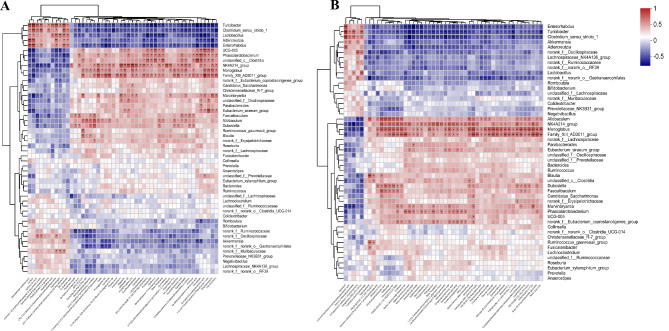
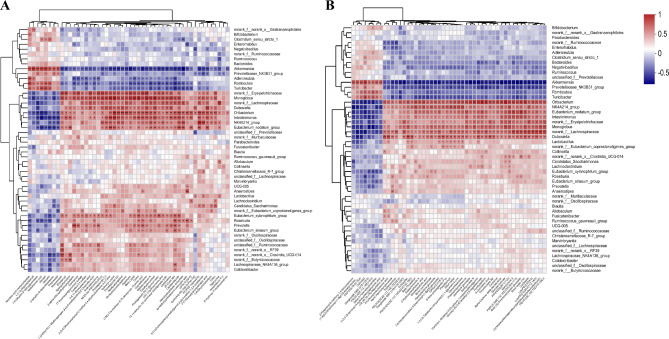
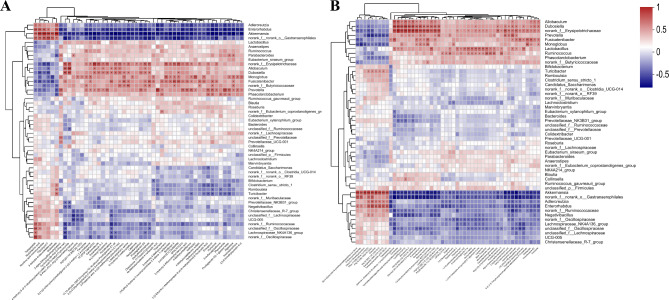
Results: Significant increment in occludin-1 and claudin-1 protein expression alleviated the diarrheal severity in IBS-D rats (P < 0.05) after treatment with FMT and TCM. FMT and TCM altered the gut microbiota and regulated the tryptophan metabolism, steroid hormone biosynthesis and glycerophospholipid metabolism of IBS-D rats with spleen deficiency syndrome.The microbial abundance were changed in each case e.g., Monoglobus, Dubosiella, and Akkermansia and othe metabolic profiles.
Conclusion: FMT and TCM treatment improved the intestinal barrier function by regulating gut microbiota and improved metabolic pathways in IBS-D with spleen deficiency syndrome.
Keywords: Fecal microbiota transplantation; Gut microbiota; Irritable bowel syndrome; Metabolomics; Spleen deficiency syndrome.
© 2024. The Author(s).
Conflict of interest statement
The authors declare no competing interests.
Figures
Similar articles
-
WenTongGanPi decoction alleviates diarrhea-predominant irritable bowel syndrome by improving intestinal barrier.J Ethnopharmacol. 2024 Nov 15;334:118544. doi: 10.1016/j.jep.2024.118544. Epub 2024 Jul 14. J Ethnopharmacol. 2024. PMID: 39013542
-
The multiple effects of fecal microbiota transplantation on diarrhea-predominant irritable bowel syndrome (IBS-D) patients with anxiety and depression behaviors.Microb Cell Fact. 2021 Dec 28;20(1):233. doi: 10.1186/s12934-021-01720-1. Microb Cell Fact. 2021. PMID: 34963452 Free PMC article.
-
Clinical response to fecal microbiota transplantation in patients with diarrhea-predominant irritable bowel syndrome is associated with normalization of fecal microbiota composition and short-chain fatty acid levels.Scand J Gastroenterol. 2019 Jun;54(6):690-699. doi: 10.1080/00365521.2019.1624815. Epub 2019 Jun 13. Scand J Gastroenterol. 2019. PMID: 31190584 Clinical Trial.
-
Fecal microbiota transplantation in patients with irritable bowel syndrome: an overview of current studies.J Appl Microbiol. 2023 Mar 1;134(3):lxad044. doi: 10.1093/jambio/lxad044. J Appl Microbiol. 2023. PMID: 36882216 Review.
-
A meta-analysis of randomized controlled trials evaluating the effectiveness of fecal microbiota transplantation for patients with irritable bowel syndrome.BMC Gastroenterol. 2024 Jul 5;24(1):217. doi: 10.1186/s12876-024-03311-x. BMC Gastroenterol. 2024. PMID: 38970007 Free PMC article.
References
-
- Ford AC, Sperber AD, Corsetti M, et al. Irritable bowel syndrome[J]. Lancet. 2020;396(10263):1675–88. - PubMed
-
- Waller K, Leong RW, Paramsothy S. An update on fecal microbiota transplantation for the treatment of gastrointestinal diseases[J]. J Gastroenterol Hepatol. 2022;37(2):246–55. - PubMed
-
- El-Salhy M, Winkel R, Casen C, et al. Efficacy of fecal microbiota transplantation for patients with irritable bowel syndrome at 3 years after Transplantation[J]. Gastroenterology. 2022;163(4):982–94. - PubMed
MeSH terms
Substances
Grants and funding
- 2023ZR004/TCM science and technology project of Zhejiang Province
- 2024KY869/Zhejiang Provincial Medical and Health Science and Technology Project
- 2022020801020508/Knowledge Innovation Program of Wuhan Shuguang Project
- 2022020801020584/Knowledge Innovation Program of Wuhan Shuguang Project
- 82374205/National Natural Science Foundation of China
LinkOut - more resources
Full Text Sources
Medical
