. 2024 Oct 25;30(1):185.
doi: 10.1186/s10020-024-00942-4.

Skeletal myotubes expressing ALS mutant SOD1 induce pathogenic changes, impair mitochondrial axonal transport, and trigger motoneuron death

Affiliations

Skeletal myotubes expressing ALS mutant SOD1 induce pathogenic changes, impair mitochondrial axonal transport, and trigger motoneuron death

Pablo Martínez et al. Mol Med. .

Abstract

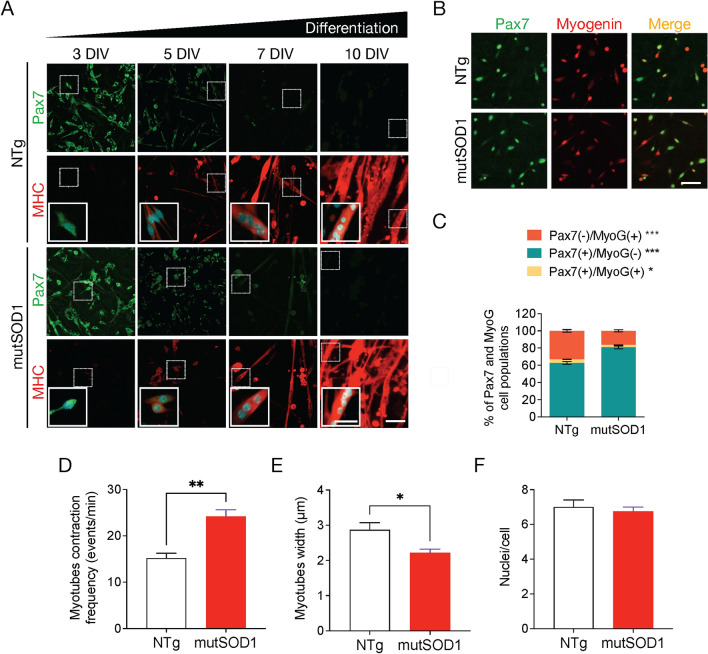
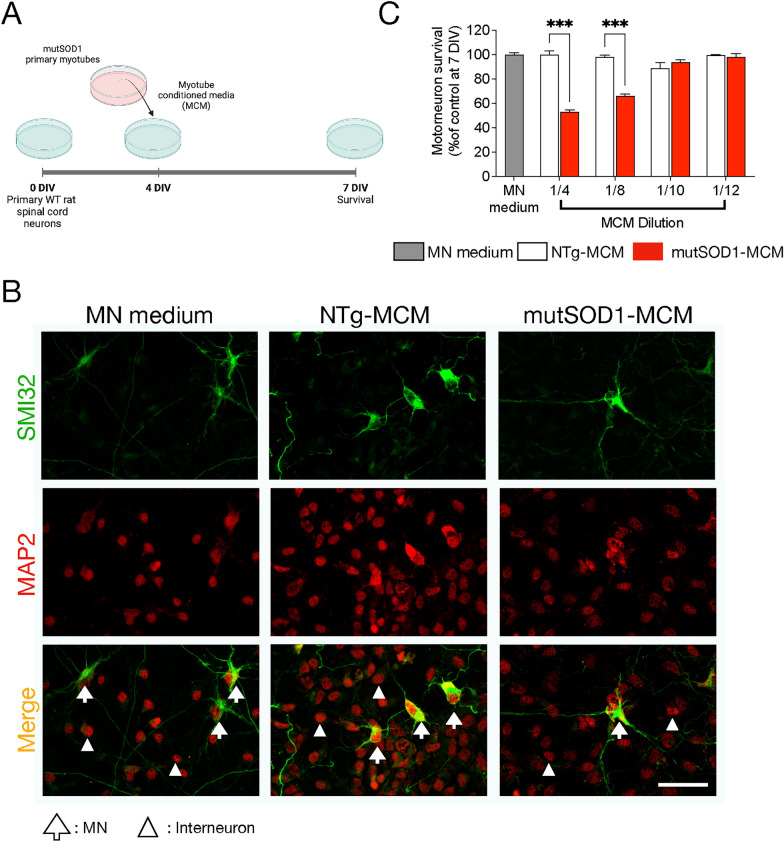
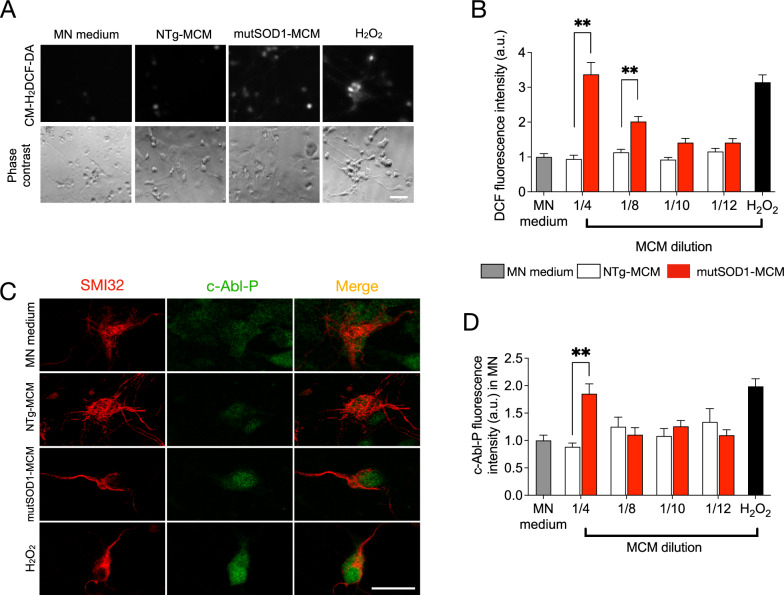
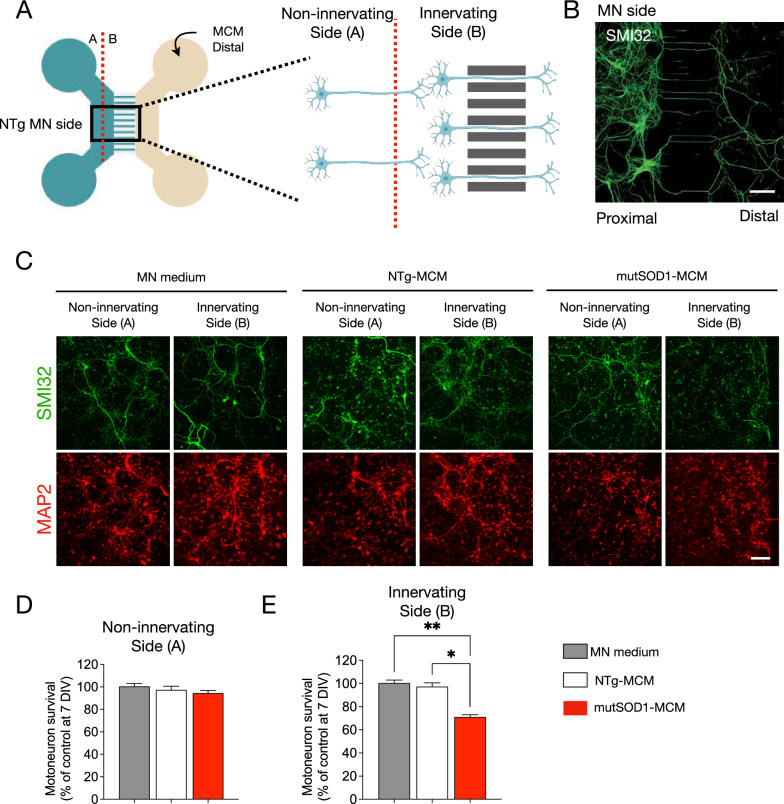
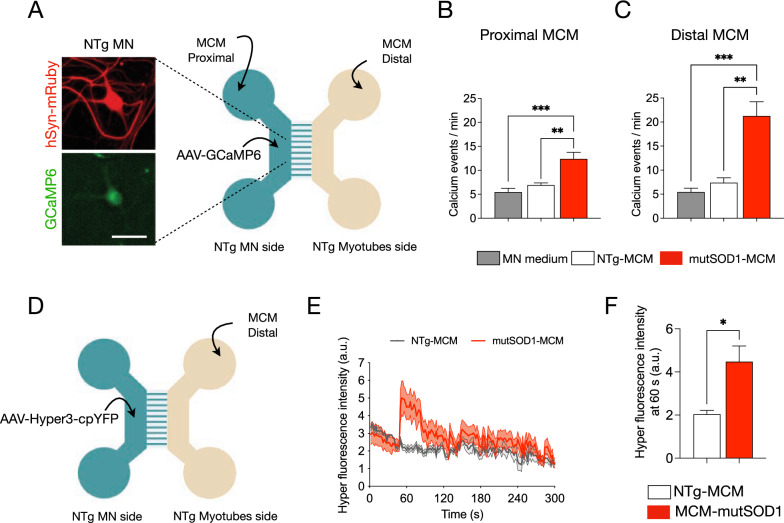
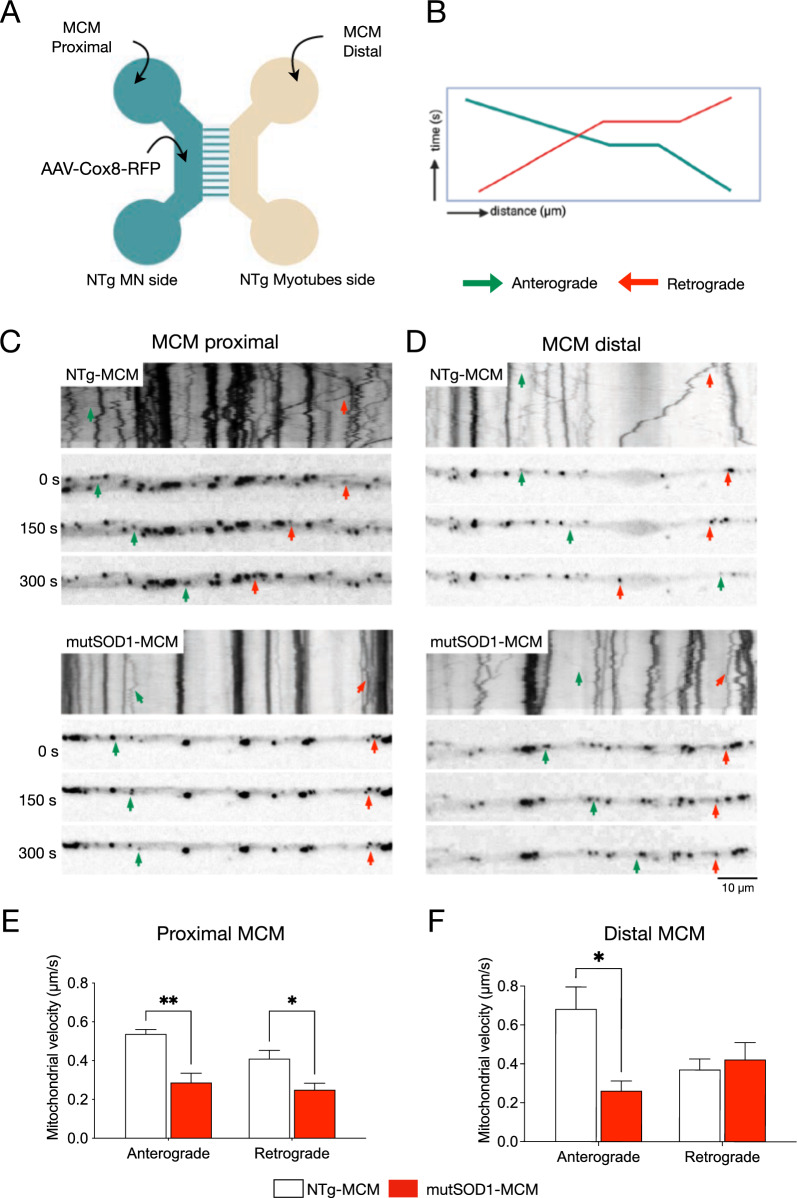
Amyotrophic lateral sclerosis (ALS) is a fatal neurodegenerative disease characterized by the loss of motoneurons (MNs), and despite progress, there is no effective treatment. A large body of evidence shows that astrocytes expressing ALS-linked mutant proteins cause non-cell autonomous toxicity of MNs. Although MNs innervate muscle fibers and ALS is characterized by the early disruption of the neuromuscular junction (NMJ) and axon degeneration, there are controversies about whether muscle contributes to non-cell-autonomous toxicity to MNs. In this study, we generated primary skeletal myotubes from myoblasts derived from ALS mice expressing human mutant SOD1G93A (termed hereafter mutSOD1). Characterization revealed that mutSOD1 skeletal myotubes display intrinsic phenotypic and functional differences compared to control myotubes generated from non-transgenic (NTg) littermates. Next, we analyzed whether ALS myotubes exert non-cell-autonomous toxicity to MNs. We report that conditioned media from mutSOD1 myotubes (mutSOD1-MCM), but not from control myotubes (NTg-MCM), induced robust death of primary MNs in mixed spinal cord cultures and compartmentalized microfluidic chambers. Our study further revealed that applying mutSOD1-MCM to the MN axonal side in microfluidic devices rapidly reduces mitochondrial axonal transport while increasing Ca2 + transients and reactive oxygen species (i.e., H2O2). These results indicate that soluble factor(s) released by mutSOD1 myotubes cause MN axonopathy that leads to lethal pathogenic changes.

Keywords: ALS; Axonopathy; Mitochondria; Motoneuron; Muscle; Myotubes; Pathology.


Conflict of interest statement

We declare no competing interests.

Figures

Fig. 1
Fig. 1
Characterization of primary mutSOD1 myoblast cultures. A Representative images of myogenic markers during myoblast differentiation in primary mutSOD1 and non-transgenic littermate (NTg) myoblast cultures. Myoblasts from P2 mice were maintained in a growth medium up to 70% confluence and then cultured in a differentiation medium to induce myotube formation. Cells were fixed at 3, 5, 7, and 10 DIV and immunostained with antibodies against Pax7 (green) and MHC (red), and DAPI (cyan) to detect nuclei (n = 3). Scale bar: 100 µm; inset: 50 µm. B Representative images of myoblast subpopulations present in primary NTg and mutSOD1 myoblast cultures. Five DIV primary mutSOD1 and NTg myoblasts were induced to differentiate into myotubes for 8 h. Cells were fixed, and immunofluorescence was performed using specific antibodies against Pax7 and myogenin (MyoG). Scale bar: 100 µm. C Pax7, and myogenin-positive (and negative) cells were quantified to obtain the enrichment percentage of each myogenic gene over the total number of cells. The quantification corresponds to 3 independent experiments, analyzed by student t-test (* p < 0.05, *** p < 0.0005). D Myotube contraction frequency, comparing NTg and mutSOD1 myotubes and quantified as event per min. Data are represented as the mean ± s.e.m., student t-test (** p < 0.005). E Myotube width. Comparison made between NTg and mutSOD1 myotubes in 3 independent experiments. Data are represented as the mean ± s.e.m., student t-test (** p < 0.005). F Number of nuclei per cell in NTg and mutSOD1 myotubes. The quantification corresponds to three independent experiments, analyzed by student t-test. No significant differences were detected
Fig. 2
Fig. 2
MCM-mutSOD1 contains soluble toxic factor(s) that induce(s) MN death. A Workflow diagram of primary WT (NTg) spinal cord cultures (4 DIV) that were exposed for 3 days to MCM derived from mutSOD1 transgenic mice (MCM-mutSOD1), NTg littermates (NTg-MCM), and culture medium (MN medium). Cells were fixed at 7 DIV, and immunofluorescence assayed cell survival. B Representative images of immunofluorescence against SMI32 (MNs; green) and MAP2 (all neurons; red) when exposed to MCM-mutSOD1 (dilution 1/4), NTg-MCM (dilution 1/4), and MN medium. Scale bar: 50 μm. C MN survival graph (SMI32+/MAP2+ cells as a percentage of all MAP2+ neurons) after treatment with MCM-mutSOD1, NTg-MCM, and MN medium for 3 DIV. Values represent the mean ± s.e.m of at least three independent experiments performed in duplicate and analyzed by one-way ANOVA (*** P < 0.0005) relative to the NTg-MCM at 7 DIV
Fig. 3
Fig. 3
MCM-mutSOD1 triggers phosphorylated c-Abl and H2O2 accumulation. A Representative images of DFC assay and phase contrast of NTg spinal cord cultures exposed to MCM-mutSOD1 (dilution 1/4), NTg-MCM (dilution 1/4), MN medium, and H2O2 (200 mM) as a positive control. Scale bar: 50 μm. B Graph of the average intensity of DFC probe in neurons treated for 90 min with MCMs at different dilutions, as indicated. The graph represents the average ± s.e.m of three experiments performed independently and analyzed by one-way ANOVA (**, P < 0.005 relative to NTg-MCM. C Representative images of immunofluorescence against phosphorylated c-abl (c-Abl-P; green) and SMI32 (MNs; red) when exposed for 90 min to MCM-mutSOD1 (dilution 1/4), NTg-MCM (dilution 1/4), and MN medium, and H2O2 (200 mM, 20 min) as a positive control. Scale bar: 50 μm. D Graphs showing fluorescence intensities (a.u.) for c-Abl-P at 4 DIV when NTg spinal cord cultures were treated acutely (90 min) with MCM at different dilutions, as indicated. The graph represents the mean ± s.e.m of three experiments performed independently and analyzed by one-way ANOVA (** P < 0.005) relative to the NTg-MCM
Fig. 4
Fig. 4
MN survival is reduced in microfluidic systems when exposed to mutSOD1-MCM. A Representative diagram showing a microfluidic device to determine the survival of primary NTg MN cultures (cultured on MN side) at 14 DIV under the distal application of MN medium, NTg-MCM and MCM-mutSOD1 for 3 DIV: indicated is the non-innervating (side A) and non-innervating (side B) of MNs. Next, MNs were fixed and incubated with specific antibodies against SMI32 to detect MNs and total nuclei visualized with NucBlue staining to obtain the ratio between MNs and total cells. B Immunostaining against SMI32 in 3 DIV NTg primary MN culture in a microfluidic device. Cells were plated in the proximal compartment and MCM-mutSOD1 was applied in the distal compartment for survival quantification. Scale bar: 200 µm. C Representative images of immunofluorescence against SMI32 (MNs; green) and MAP2 (all neurons; red) when exposed to MN medium, NTg-MCM, and MCM-mutSOD1 in the non-innervating (side A) and non-innervating (side B) of the proximal chamber. In none of these conditions, we observed a significant difference in the number of axons crossing the microfluidic slit. Scale bar: 100 μm. D Quantification of survival of non-innervating MN after distal treatment with MN medium, NTg-MCM and MCM-mutSOD1 in a microfluidic chamber. Values represent the mean ± s.e.m. of three independent experiments and analyzed by one-way ANOVA relative to the NTg-MCM at 17 DIV. E Graph of survival of innervating MN after distal treatment with MN medium, NTg-MCM and MCM-mutSOD1 in the microfluidic chamber. Values represent the mean ± s.e.m. of three independent experiments and were analyzed by one-way ANOVA (*P < 0.05 **P < 0.005) relative to the NTg-MCM relative to the control medium at 17 DIV
Fig. 5
Fig. 5
Application of mutSOD1-MCM rapidly increases calcium transients and induces H2O2 accumulation in wild-type MNs. A Representative diagram of NTg MNs and NTg myotubes co-cultured in a microfluidic chamber. Images show examples of MN that were subjected to transduction with AAV1/2-hSyn-mRuby2-GCaMP6s (titer 106 particles/µl; hSyn-mRuby in red, and GMaMP6s in green, left panel). Seven days later, cultures were exposed to NTg-MCM and MCM-mutSOD1 in the myotube (distal) or MN (proximal) compartment for 10 min before measuring calcium events. Scale bar: 50 µm. B, C Quantification of the number of calcium events per min of MN exposed to the different MCMs, as indicated. Values of the graph represent the mean ± s.e.m. of three independent experiments and analyzed by one-way ANOVA (** P < 0.005, *** P < 0.0005) relative to the MN medium and NTg-MCM. D Schematic of a co-culture of NTg MNs expressing the Hyper-3 sensor (using the AAV1/2 with titer 10.6 particles/µl) and NTg myotubes from P2 mice in a microfluidic chamber, where MCM (NTg and mutSOD1) were applied in the distal myotube compartment. E Signal profile plot of Hyper3 fluorescent signal vs. time after application NTg-MCM and MCM-mutSOD1.Values of the graph represent the experimental average of six cells (n = 6), using the same microfluidic chamber, and analyzed by t-student test (*P < 0.05) relative to NTg-MCM. F Fluorescent intensity of Hyper measured at 60 s from the profile, after application NTg-MCM and MCM-mutSOD1. Values represent the mean ± s.e.m. and analyzed by t-student test (*P < 0.05) relative to NTg-MCM (n = 6)
Fig. 6
Fig. 6
MCM-mutSOD1 applied proximally affects both antegrade and retrograde axonal transport. A Representative diagram of MN and myotube co-cultures in a microfluidic chamber. MNs were subjected to transduction with AAV1/2-Cox8-RFP (1 × 106 particles/µl). Seven days later, cultures were exposed to NTg-MCM and MCM-mutSOD1 in the MN (proximal) or myotube (distal) compartment for 24 h for mitochondrial recording. B Schematic of a kymograph to quantify mitochondria movements. Green lines and arrows indicate anterograde movements (from MN soma to axons), while red lines and arrows indicate retrograde movements (from axons to MN soma). C, D Representative kymographs of mitochondrial movement in MN axons exposed to the different MCM, as indicated. E, F Graphs of axonal mitochondrial velocity quantified from generated kymographs when MCM was applied in the proximal (E) and distal (F) chambers. Values of the graph represent the mean ± s.e.m. of three independent experiments and analyzed by t-Student test (*P < 0.1, **P < 0.01) relative to NTg-MCM

Update of

Similar articles

Cited by

References

    1. Aguirre T, van Den Bosch L, Goetschalckx K, et al. Increased sensitivity of fibroblasts from amyotrophic lateral sclerosis patients to oxidative stress. Ann Neurol. 1998;43:452–7. 10.1002/ana.410430407. - PubMed
    1. Al-Chalabi A, Hardiman O. The epidemiology of ALS: a conspiracy of genes, environment and time. Nat Rev Neurol. 2013;9:617–28. 10.1038/nrneurol.2013.203. - PubMed
    1. Arredondo C, Cefaliello C, Dyrda A, et al. Excessive release of inorganic polyphosphate by ALS/FTD astrocytes causes non-cell-autonomous toxicity to motoneurons. Neuron. 2022;110:1656-1670.e12. 10.1016/j.neuron.2022.02.010. - PMC - PubMed
    1. Aurnhammer C, Haase M, Muether N, et al. Universal real-time PCR for the detection and quantification of adeno-associated virus serotype 2-derived inverted terminal repeat sequences. Hum Gene Ther Part b Methods. 2012;23:18–28. 10.1089/hgtb.2011.034. - PubMed
    1. Badu-Mensah A, Guo X, McAleer CW, et al. Functional skeletal muscle model derived from SOD1-mutant ALS patient iPSCs recapitulates hallmarks of disease progression. Sci Rep. 2020;10:14302. 10.1038/s41598-020-70510-3. - PMC - PubMed

MeSH terms

LinkOut - more resources