. 2024 Oct 25;24(1):1313.
doi: 10.1186/s12885-024-13081-0.

Identification of molecular subtypes based on bile acid metabolism in cholangiocarcinoma

Affiliations

Identification of molecular subtypes based on bile acid metabolism in cholangiocarcinoma

Mingxia Deng et al. BMC Cancer. .

Abstract

Background: Cholangiocarcinoma is a highly heterogeneous tumor with bile acid metabolism involving in its development. The aim of this study was to characterize bile acid metabolism and identify specific subtypes to better stratify cholangiocarcinoma patients for individualized treatment and prognostic assessment.

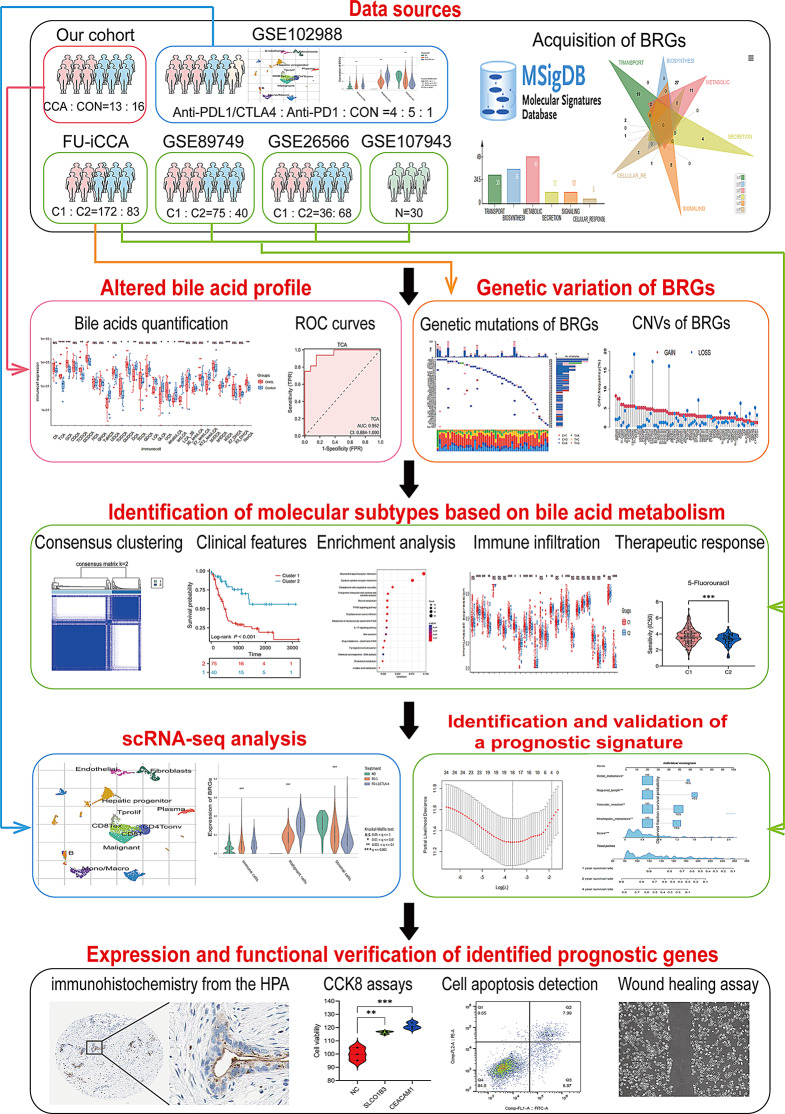
Methods: A total of 30 bile acids were quantified using the ultra-performance liquid chromatography tandem mass spectrometry. Using Consensus clustering, the molecular subtypes related to bile acid metabolism were identified. The prognosis, clinicopathologic characteristics, immune landscape, and therapeutic response were compared between these subtypes. The single-cell RNA sequencing (scRNA-seq) analysis and preliminary cell experiment were also conducted to verify our findings.

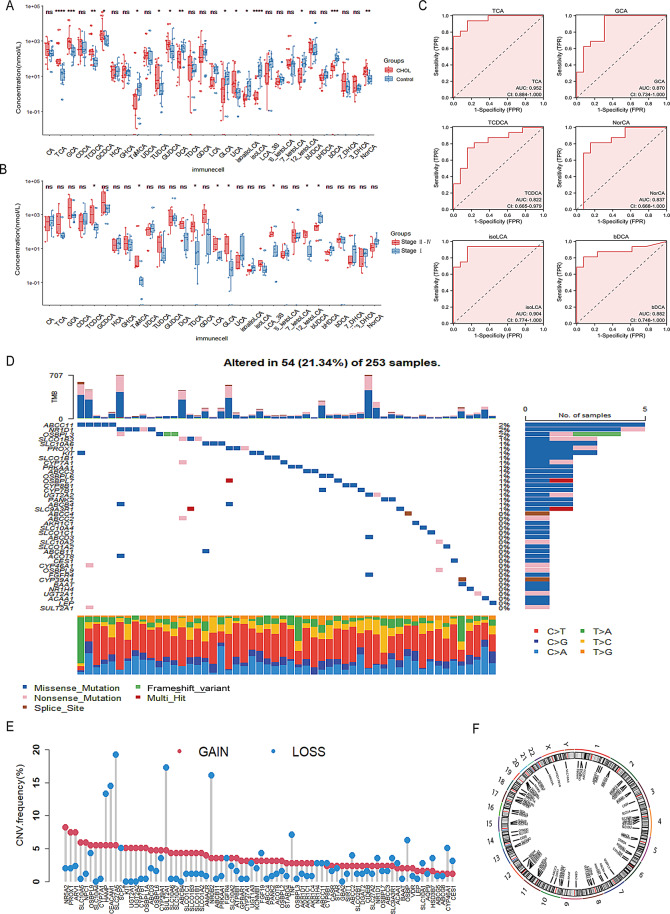
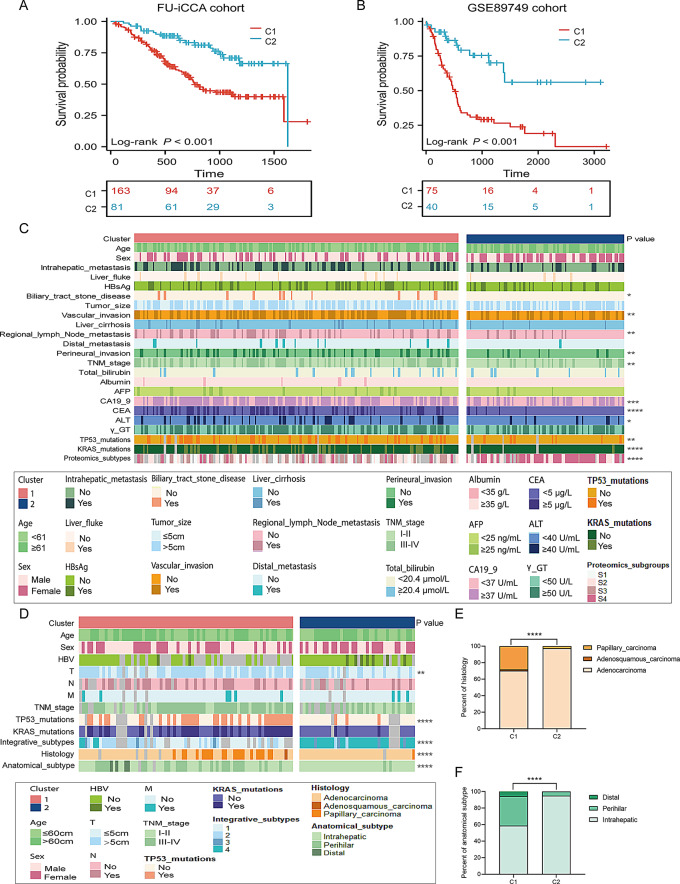
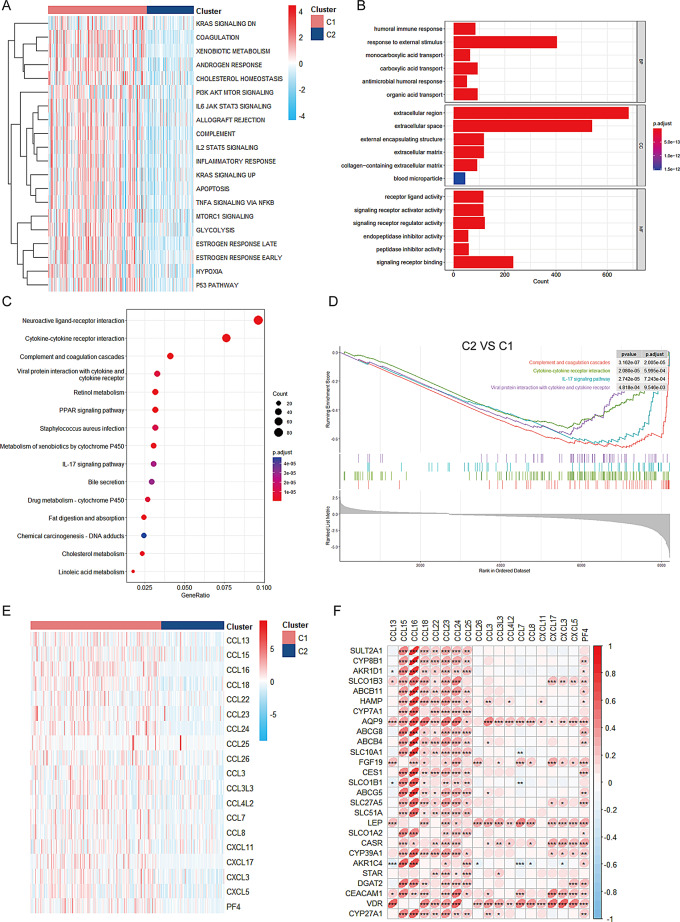
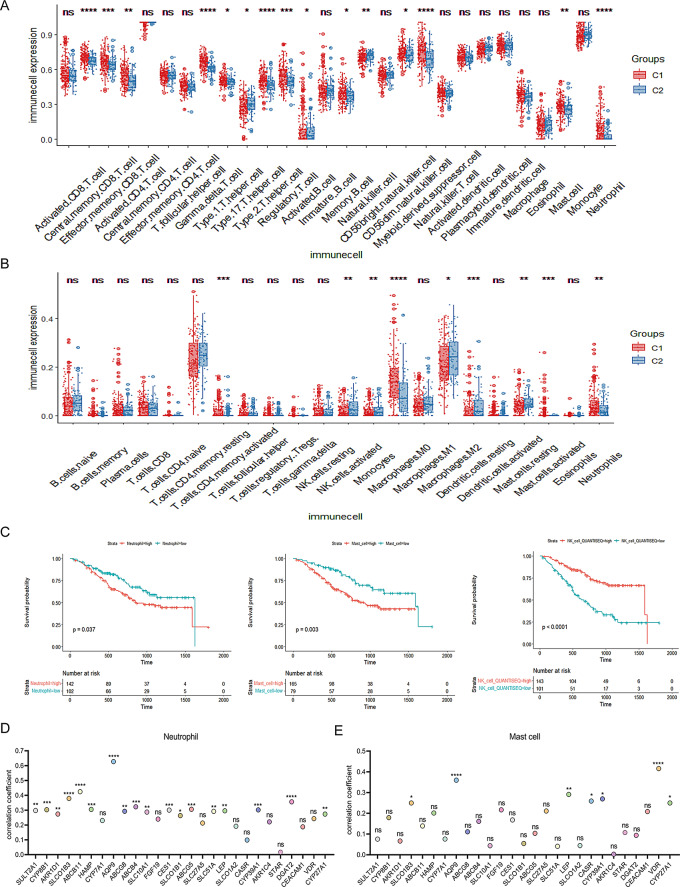
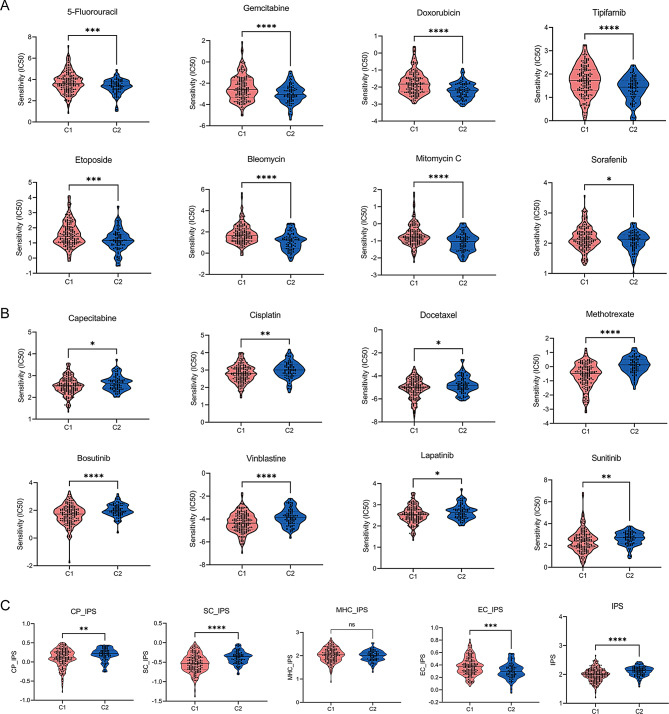
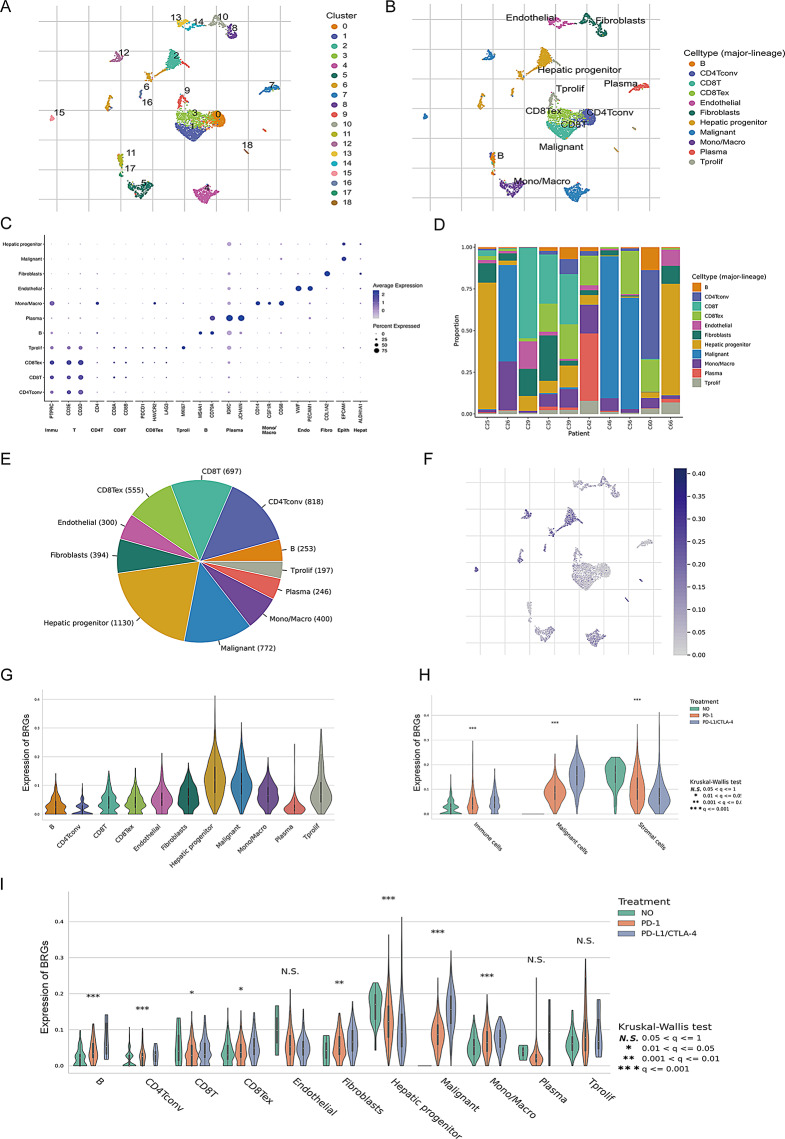
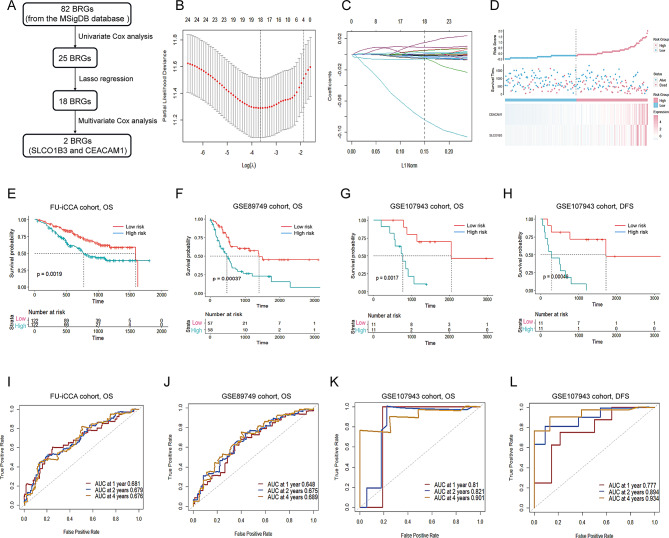
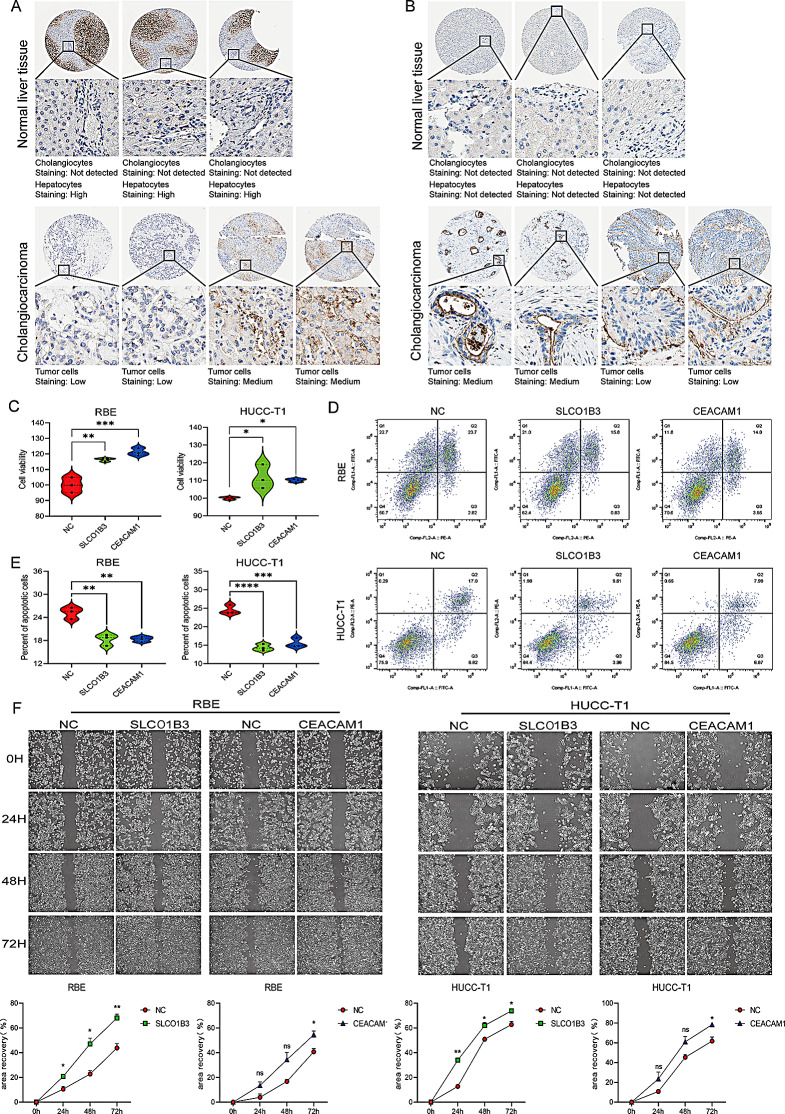
Results: The altered bile acid profile and genetic variation of bile acid metabolism-related genes in cholangiocarcinoma were demonstrated. The cholangiocarcinoma was categorized into bile acid metabolism-active and -inactive subtypes with different prognoses, clinicopathologic characteristics, tumor microenvironments (TME) and therapeutic responses. This categorization was reproducible and predictable. Specifically, the bile acid metabolism-active subtype showed a poor prognosis with an immunosuppressive microenvironment and an inactive response to immunotherapy, while the bile acid metabolism-inactive subtype showed the opposite characteristics. Moreover, the scRNA-seq revealed that immunotherapy altered bile acid metabolism in TME of cholangiocarcinoma. Finally, a prognostic signature related to bile acid metabolism was developed, which exhibited strong power for prognostic assessment of cholangiocarcinoma. Consistently, these results were verified by immunohistochemistry, cell proliferation, migration, and apoptosis assays.

Conclusion: In conclusion, a novel cholangiocarcinoma classification based on bile acid metabolism was established. This classification was significant for the estimation of TME and prognosis.

Keywords: Bile acids; Cholangiocarcinoma; Prognosis; Subtypes; Tumor microenvironment.


Conflict of interest statement

The authors declare no competing interests.

Figures

Fig. 1
Fig. 1
The workflow of this study BRGs, bile acid-related genes; CCA, cholangiocarcinoma; CNVs, copynumber variations. scRNA-seq, single cell RNA sequencing
Fig. 2
Fig. 2
The altered bile acid profile and genetic variation of bile acid-related genes in cholangiocarcinoma The altered bile acid profile in patients with CCA (A). Increased bile acids in patients with advanced cholangiocarcinoma(B). ROC curve for bile acids with the areas under the curve greater than 0.8 (C). Genetic variation of 82 BRGs in the FU-iCCA cohort (D). Positions of CNVs in BRGs on chromosomes (E)
Fig. 3
Fig. 3
Identification of two bile acid metabolism-related subtypes in cholangiocarcinoma Consensus clustering heatmap of two subtypes (k = 2) (A). Principal component analysis of the two subtypes (B). Differences in the expression of BRGs between the two subtypes (C). Subclass mapping of the FU-iCCA cohort and GSE89749 cohort subtypes (D). Subclass mapping of the FU-iCCA cohort and GSE26566 cohort subtypes (E). Bonferroni adjusted p-values indicate correlations between subtypes. Red represents significant similarities between subtypes (p < 0.05), while blue represents differences between subtypes (p > 0.05)
Fig. 4
Fig. 4
Clinical and prognostic characteristics of bile acid-related subtypes in FU-iCCA and GSE89749 cohorts Survival analyses between two bile acid-related subtypes in the FU-iCCA cohorts (A) and GSE89749 cohorts (B). Correlation between clinical characteristics and the CCA subtypes in the FU-iCCA cohorts (C) and the GSE89749 cohorts (D). Percentage stacked bar charts show histological (E) and anatomical (F) differences in bile acid-related subtypes of CCA. Clinical data of GSE26566 were not available
Fig. 5
Fig. 5
Transcriptome analysis of bile acid-related subtypes GSVA enrichment analysis (A), GO enrichment analysis (B), KEGG pathway analysis (C) and GSVA enrichment analysis (D) between two bile acid-related subtypes. Distinct expression of chemokines between two bile acid-related subtypes (E). Spearman rank correlation between bile acid-related genes and chemokines (F)
Fig. 6
Fig. 6
Immune infiltration of two bile acid-related subtypes in the FU-iCCA cohort Immune infiltration of two bile acid-related subtypes by ssGSEA (A) and Cibersortx (B). Kaplan–Meier survival analysis of the neutrophils, mast cells and NK cells in patients with CCA (C). Spearman rank correlation coefficient between bile acid-related genes and neutrophils (D), mast cells (E)
Fig. 7
Fig. 7
Comparisons of drug sensitivity in bile acid metabolism-related subtypes Drugs that are more sensitive to patients in subtype C2 (A). Drugs that are more sensitive to patients in subtype C1 (B). Different immunophenoscore between bile acid-related subtypes(C)
Fig. 8
Fig. 8
The alteration of BRGs expression induced by immunotherapy in the TISCH database. Cells are colored by cell clusters (A) or cell type (B) in a UMAP graphic. The marker gene expression level for each annotated cell types (C). Percentage of different cell types in CCA patients (D). The total number of cells in every cell-type (E). Distribution (F) and expression (G) of BRGs in different cells. Expression of BRGs in different cell types from the malignancy level (H) and the major-lineage level (I) following different treatments
Fig. 9
Fig. 9
Identification and verification of a bile acid-related signature with prognostic significance. Flow chart shows the process by which the bile acid-related signature with prognostic significance was identified (A). Cross-validation for optimal gene selection (B). The Lasso coefficient profiles (C). An overview of survival, risk scores and key genes (D). Survival analysis for overall survival based on the risk score in FU-iCCA cohort (E), GSE89749 cohort (F) and GSE107943 cohort (G). Survival analysis for disease-free survival based on risk score in GSE107943 cohort (H). Time-dependent ROC curves for predicting overall survival rates in FU-iCCA cohort (I), GSE89749 cohort (J) and GSE107943 cohort (K). Time-dependent ROC curves for predicting disease-free survival rates in the GSE107943 cohort (L)
Fig. 10
Fig. 10
Development and evaluation of the nomogram Univariate regression (A) and multivariate regression (B) of clinicopathological indicators and risk score. A comprehensive nomogram to predict the survival probability of CCA patients at 1, 2, and 4 years (C). The time-dependent ROC curves (D), calibration curve (E) and decision curve analysis (F) of the nomogram
Fig. 11
Fig. 11
Expression and functional verification of identified prognostic genes Immunohistochemistry results of SLCO1B3 (A) and CEACAM1(B) in human normal liver tissue and cholangiocarcinoma tissue from the Human Protein Atlas. Overexpression of SLCO1B3 or CEACAM1 promotes the proliferation (C), reduces apoptosis rates (D-E), and promotes the migration (F) of RBE cells and HUCC-T1 cells

Similar articles

References

    1. Raggi C, Taddei ML, Rae C, Braconi C, Marra F. Metabolic reprogramming in cholangiocarcinoma. J Hepatol. 2022;77(3):849–64. 10.1016/j.jhep.2022.04.038. - PubMed
    1. Fabris L, Sato K, Alpini G, Strazzabosco M. The Tumor Microenvironment in Cholangiocarcinoma Progression. Hepatology. 2021;73(1):75–85. 10.1002/hep.31410. - PMC - PubMed
    1. Chen S, Xie Y, Cai Y, Hu H, He M, Liu L, et al. Multiomic analysis reveals Comprehensive Tumor heterogeneity and distinct Immune subtypes in Multifocal Intrahepatic Cholangiocarcinoma. Clin Cancer Res. 2022;28(9):1896–910. 10.1158/1078-0432.CCR-21-1157. - PubMed
    1. Ma L, Wang L, Khatib SA, Chang CW, Heinrich S, Dominguez DA, et al. Single-cell atlas of tumor cell evolution in response to therapy in hepatocellular carcinoma and intrahepatic cholangiocarcinoma. J Hepatol. 2021;75(6):1397–408. 10.1016/j.jhep.2021.06.028. - PMC - PubMed
    1. Komuta M. Intrahepatic cholangiocarcinoma: Tumour heterogeneity and its clinical relevance. Clin Mol Hepatol. 2022;28(3):396–407. 10.3350/cmh.2021.0287. - PMC - PubMed

MeSH terms

LinkOut - more resources