. 2024 Oct 25;24(1):431.
doi: 10.1186/s12866-024-03579-9.

The associations between gut microbiota and fecal metabolites with intelligence quotient in preschoolers

Affiliations

The associations between gut microbiota and fecal metabolites with intelligence quotient in preschoolers

Jinghua Long et al. BMC Microbiol. .

Abstract

Background: The awareness of the association between the gut microbiota and human intelligence levels is increasing, but the findings are inconsistent. Furthermore, few research have explored the potential role of gut microbial metabolites in this association. This study aimed to investigate the associations of the gut microbiota and fecal metabolome with intelligence quotient (IQ) in preschoolers.

Methods: The 16 S rRNA sequencing and widely targeted metabolomics were applied to analyze the gut microbiota and fecal metabolites of 150 children aged 3-6 years. The Wechsler Preschool and Primary Scale of Intelligence, Fourth Edition (WPPSI-IV) was used to assess the cognitive competence.

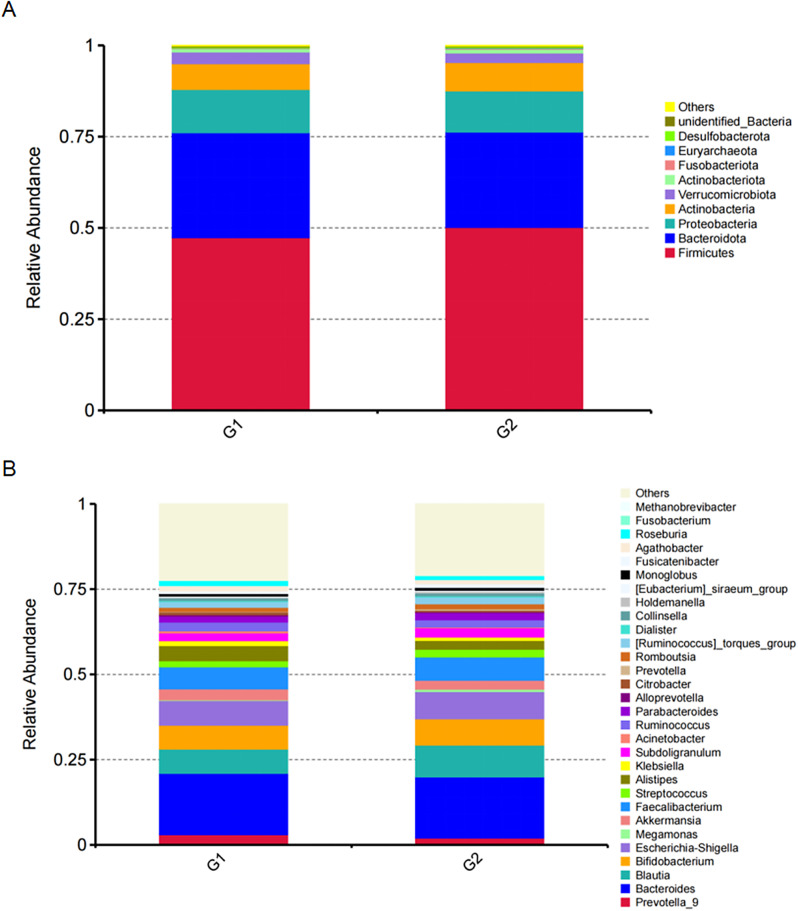
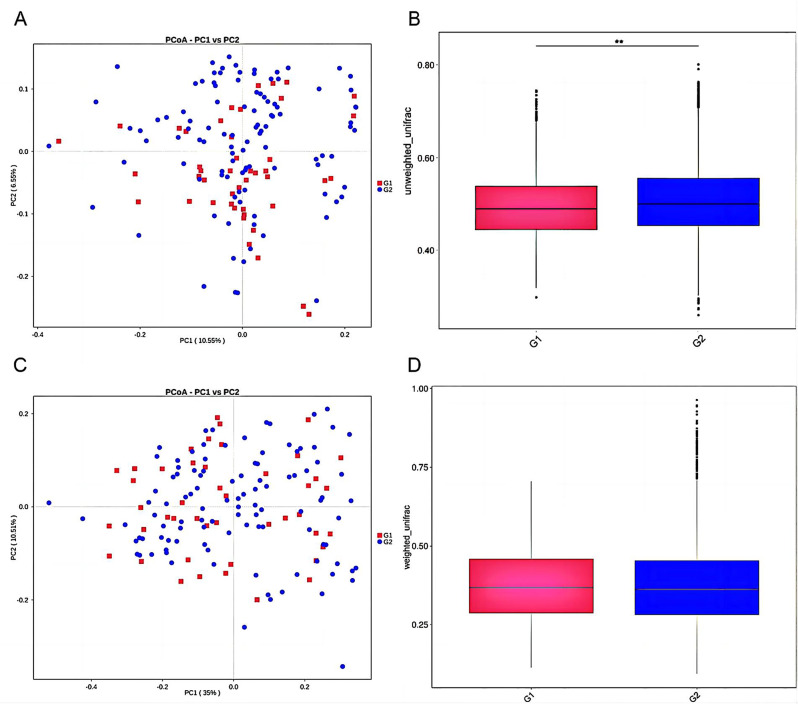
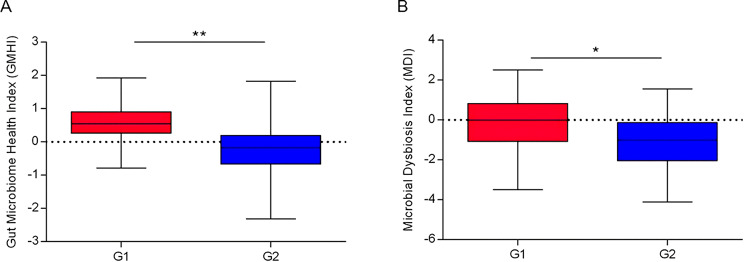
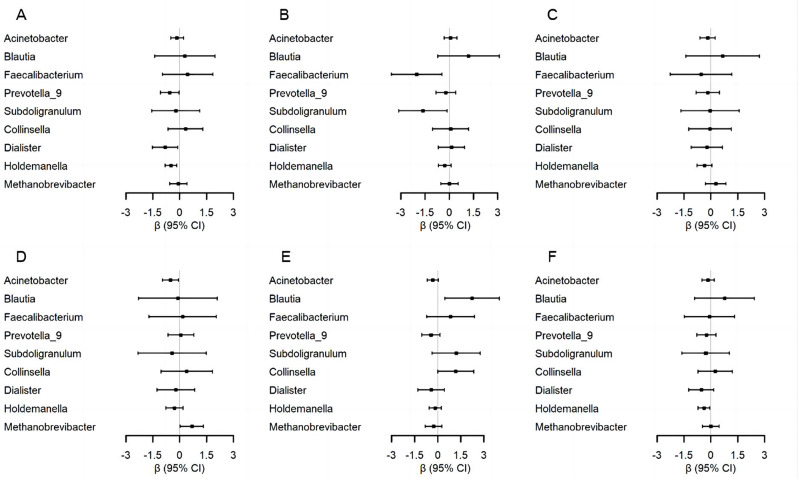
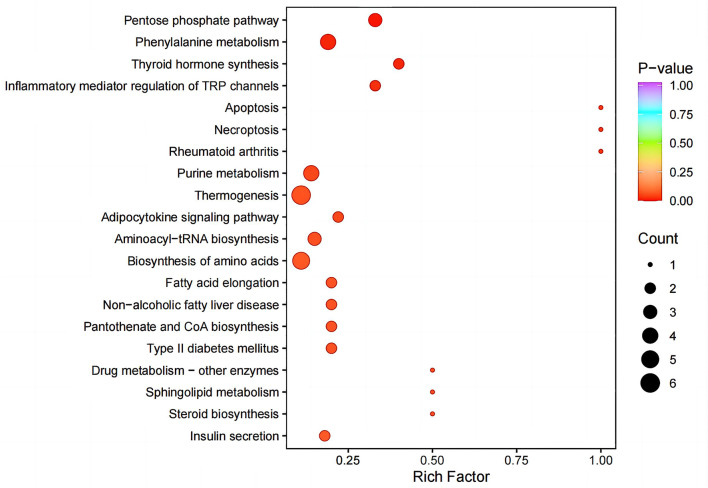
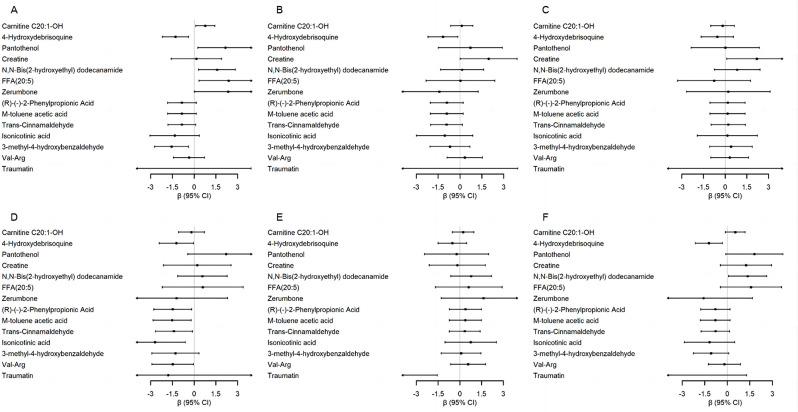
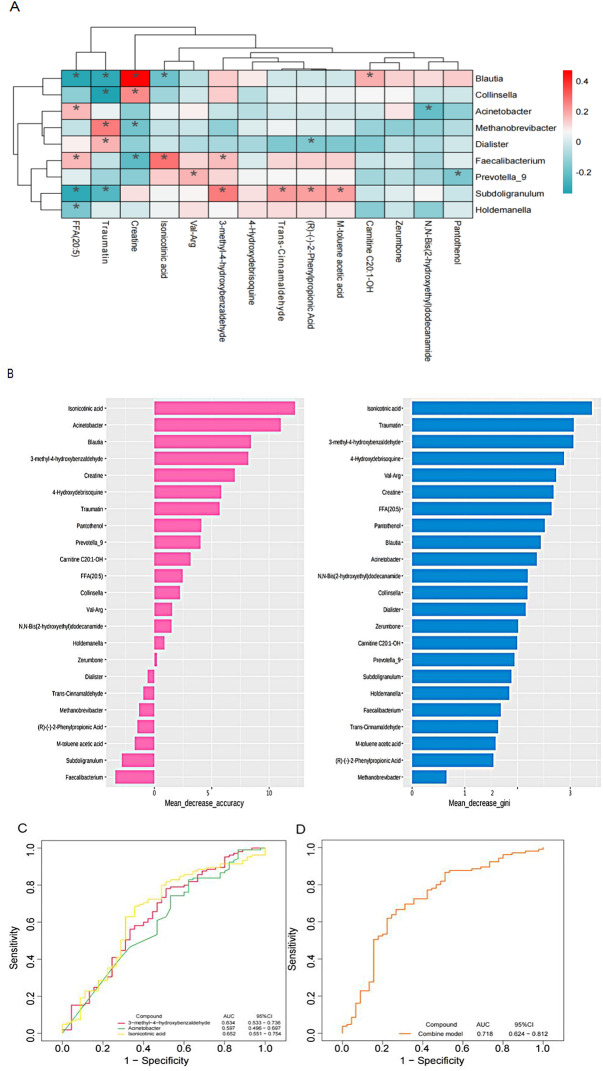
Results: The observed species index, gut microbiome health index, and microbial dysbiosis index presented significant differences between children with full-scale IQ (FSIQ) below the borderline (G1) and those with average or above-average (all P < 0.05). The abundance of Acinetobacter, Blautia, Faecalibacterium, Prevotella_9, Subdoligranulum, Collinsella, Dialister, Holdemanella, and Methanobrevibacter was significantly associated with preschooler's WPPSI-IV scores (P < 0.05). In all, 87 differential metabolites were identified, mainly including amino acid and its metabolites, fatty acyl, and benzene and substituted derivatives. The differential fecal metabolites carnitine C20:1-OH, 4-hydroxydebrisoquine, pantothenol, creatine, N,N-bis(2-hydroxyethyl) dodecanamide, FFA(20:5), zerumbone, (R)-(-)-2-phenylpropionic acid, M-toluene acetic acid, trans-cinnamaldehyde, isonicotinic acid, val-arg, traumatin, and 3-methyl-4-hydroxybenzaldehyde were significantly associated with the preschooler's WPPSI-IV scores (P < 0.05). The combination of Acinetobacter, Isonicotinic acid, and 3-methyl-4-hydroxybenzaldehydenine may demonstrate increased discriminatory power for preschoolers in G1.

Conclusion: This study reveals a potential association between gut microbiome and metabolites with IQ in preschoolers, providing new directions for future research and practical applications. However, due to limitations such as the small sample size, unclear causality, and the complexity of metabolites, more validation studies are still needed to further elucidate the mechanisms and stability of these associations.

Keywords: Fecal metabolome; Gut microbiota; Intelligence quotient; Preschoolers.


Conflict of interest statement

The authors declare no competing interests.

Figures

Fig. 1
Fig. 1
Histogram of the relative abundance at phylum (A) and genus (B) levels. G1, FSIQ score ≤ 79; G2, FSIQ score ≥ 80
Fig. 2
Fig. 2
Beta analysis of gut microbiome in preschoolers.between G1 and G2. A and C, PCoA plot; B and D, boxplots. G1, FSIQ score ≤ 79; G2, FSIQ score ≥ 80. **, P < 0.001
Fig. 3
Fig. 3
Comparative analysis of GMHI and MDI between G1 and G2. A, GMHI comparison between G1 and G2; B, MDI comparison between G1 and G2. G1, FSIQ score ≤ 79; G2, FSIQ score ≥ 80. *, P < 0.05; **, P < 0.001
Fig. 4
Fig. 4
Association between the relative abundance of nine of the top 30 genera and children’s intelligence quotient. Abbreviations 95%CI, 95% credible interval; A, VCI, verbal comprehension index; B, VSI, the visual space index; C, FRI, the fluid reasoning index; D, WMI, the working memory index; E, PSI, processing speed index; F, FSIQ, full-scale intelligence quotient. The models were adjusted for maternal pre-pregnancy BMI, maternal age at delivery, maternal education, household income, delivery mode, gestational age, breastfeeding duration, child age, and child sex
Fig. 5
Fig. 5
KEGG enrichment map of differential metabolites. The horizontal coordinate represents the rich factor corresponding to each pathway, the vertical coordinate is the pathway name (show the top 20 pathways ranked by P-value), the color of the points reflects the P-value size, and the more red indicates the more significant enrichment. The size of the dots represents the number of differentiated metabolites enriched
Fig. 6
Fig. 6
Association between the relative abundance of 14 differential metabolites and children’s intelligence quotient. Abbreviations: 95%CI, 95% credible interval; A, VCI, verbal comprehension index; B, VSI, the visual space index; C, FRI, the fluid reasoning index; D, WMI, the working memory index; E, PSI, processing speed index; F, FSIQ, full-scale intelligence quotient. The models were adjusted for maternal pre-pregnancy BMI, maternal age at delivery, maternal education, household income, delivery mode, gestational age, breastfeeding duration, child age, and child sex A
Fig. 7
Fig. 7
Comprehensive correlation analysis of gut microbiome and fecal metabolites. A, Heatmap of the Spearman correlation between 9 bacteria genera and 14 fecal differential metabolites (*FDR < 0.05), the red squares suggest a positive relationship, while the green squares signify a negative relationship. B, Variable importance of gut microbiome and fecal metabolites was identified from random forest classifiers, the variables are ranked in descending order based on their importance to the accuracy of the model.“MeanDecreaseAccuracy” and “MeanDecreaseGini” are represented by magenta and blue bars, respectively. C, Unicompounds bestmodel ROC, the red curve represents 3-methyl-4-hydroxybenzaldehyde, the green curve represents Acinetobacter, and the yellow curve represents Isonicotinic acid. D, Combined bestmodel ROC

Similar articles

References

    1. Cryan JF, Dinan TG. Mind-altering microorganisms: the impact of the gut microbiota on brain and behaviour. Nat Rev Neurosci. 2012;13(10):701–12. - PubMed
    1. Wang Q, Yang Q, Liu X. The microbiota-gut-brain axis and neurodevelopmental disorders. Protein Cell. 2023;14(10):762–75. - PMC - PubMed
    1. Muhammad F, Fan B, Wang R, Ren J, Jia S, Wang L, Chen Z, Liu XA. The Molecular Gut-Brain Axis in Early Brain Development. Int J Mol Sci 2022, 23(23). - PMC - PubMed
    1. Carlson AL, Xia K, Azcarate-Peril MA, Goldman BD, Ahn M, Styner MA, Thompson AL, Geng X, Gilmore JH, Knickmeyer RC. Infant gut Microbiome Associated with Cognitive Development. Biol Psychiatry. 2018;83(2):148–59. - PMC - PubMed
    1. Cowan CSM, Dinan TG, Cryan JF. Annual Research Review: critical windows - the microbiota-gut-brain axis in neurocognitive development. J Child Psychol Psychiatry Allied Discip. 2020;61(3):353–71. - PubMed

Substances

LinkOut - more resources