. 2024 Oct 25;19(1):80.
doi: 10.1186/s13024-024-00770-4.

Repetitive transcranial magnetic stimulation alleviates motor impairment in Parkinson's disease: association with peripheral inflammatory regulatory T-cells and SYT6

Affiliations

Repetitive transcranial magnetic stimulation alleviates motor impairment in Parkinson's disease: association with peripheral inflammatory regulatory T-cells and SYT6

Fen Xie et al. Mol Neurodegener. .

Abstract

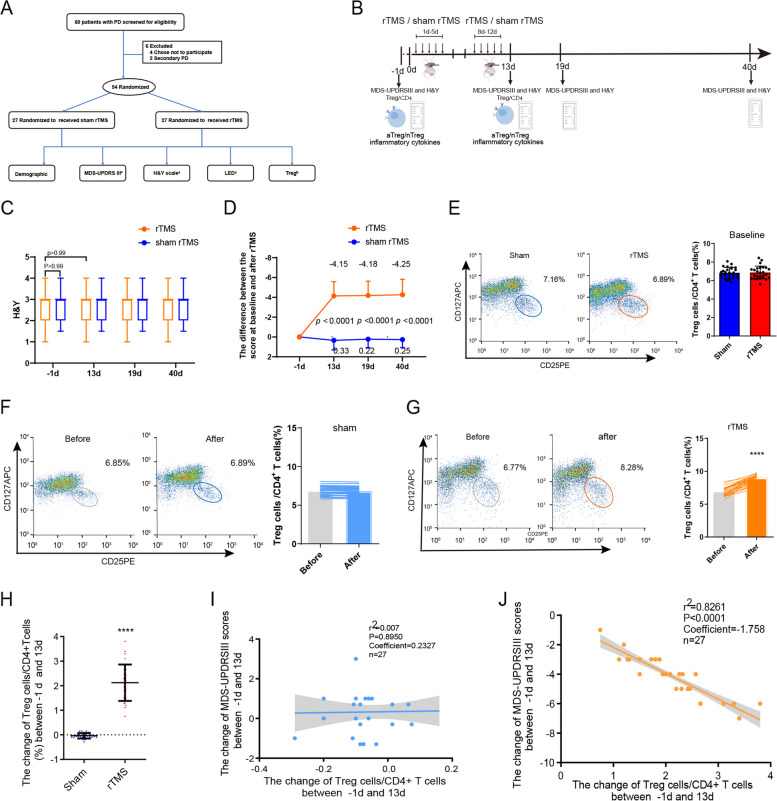
Background: Repetitive transcranial magnetic stimulation (rTMS) has been used to treat various neurological disorders. However, the molecular mechanism underlying the therapeutic effect of rTMS on Parkinson's disease (PD) has not been fully elucidated. Neuroinflammation like regulatory T-cells (Tregs) appears to be a key modulator of disease progression in PD. If rTMS affects the peripheral Tregs in PD remains unknown.

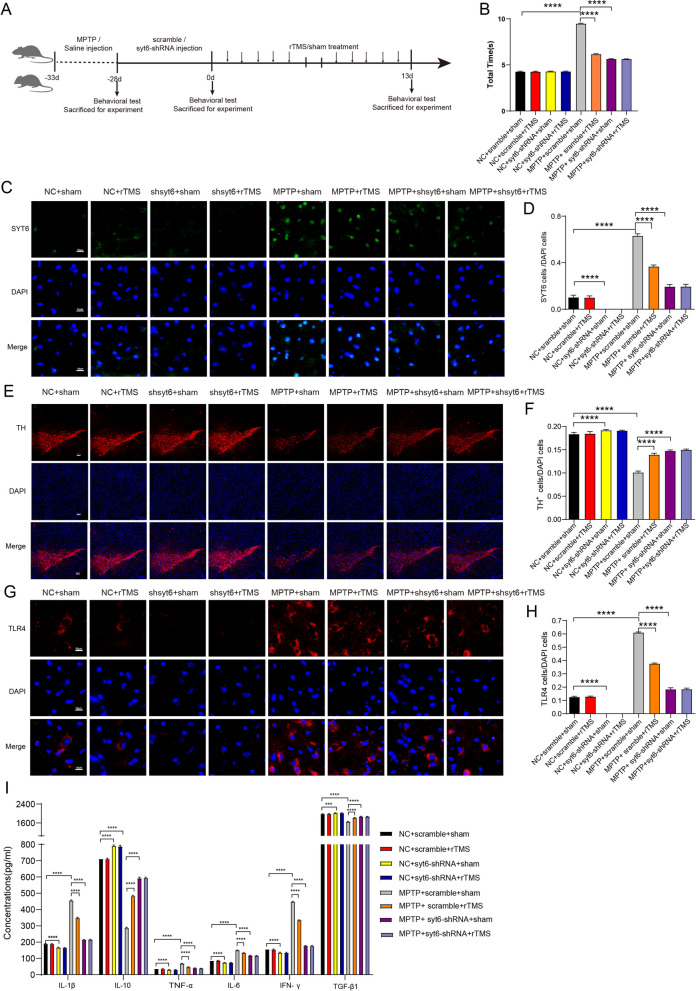
Methods: Here, we conducted a prospective clinical study (Chinese ClinicalTrials. gov: ChiCTR 2100051140) involving 54 PD patients who received 10-day rTMS (10 Hz) stimulation on the primary motor cortex (M1) region or sham treatment. Clinical and function assessment as well as flow cytology study were undertaken in 54 PD patients who were consecutively recruited from the department of neurology at Zhujiang hospital between September 2021 and January 2022. Subsequently, we implemented flow cytometry analysis to examine the Tregs population in spleen of MPTP-induced PD mice that received rTMS or sham treatment, along with quantitative proteomic approach reveal novel molecular targets for Parkinson's disease, and finally, the RNA interference method verifies the role of these new molecular targets in the treatment of PD.

Results: We demonstrated that a 10-day rTMS treatment on the M1 motor cortex significantly improved motor dysfunction in PD patients. The beneficial effects persisted for up to 40 days, and were associated with an increase in peripheral Tregs. There was a positive correlation between Tregs and motor improvements in PD cases. Similarly, a 10-day rTMS treatment on the brains of MPTP-induced PD mice significantly ameliorated motor symptoms. rTMS reversed the downregulation of circulating Tregs and tyrosine hydroxylase neurons in these mice. It also increased anti-inflammatory mediators, deactivated microglia, and decreased inflammatory cytokines. These effects were blocked by administration of a Treg inhibitor anti-CD25 antibody in MPTP-induced PD mice. Quantitative proteomic analysis identified TLR4, TH, Slc6a3 and especially Syt6 as the hub node proteins related to Tregs and rTMS therapy. Lastly, we validated the role of Treg and rTMS-related protein syt6 in MPTP mice using the virus interference method.

Conclusions: Our clinical and experimental studies suggest that rTMS improves motor function by modulating the function of Tregs and suppressing toxic neuroinflammation. Hub node proteins (especially Syt6) may be potential therapeutic targets.

Trial registration: Chinese ClinicalTrials, ChiCTR2100051140. Registered 15 December 2021, https://www.chictr.org.cn/bin/project/edit?pid=133691.

Keywords: Motor dysfunction, syt6; Neuro-inflammation; Parkinson’s disease; Regulatory T cells; Repetitive transcranial magnetic stimulation.


Conflict of interest statement

The authors declare that they have no conflict of interest.

Figures

Fig. 1
Fig. 1
rTMS treatment improved motor functions and increased the proportion of peripheral Tregs in PD patients. A Study flow chart. Sixty patients with PD were screened for eligibility in this clinical study between Sep 2021 and Jan 2022. A total of 6 PD patients were ultimately excluded. Finally, the 54 PD patients were randomized (1: 1) to divided into sham and rTMS group. Demographic data, basic examinations including electroencephalography, medication dosage before and after rTMS or sham treatment were carried out in both groups of patients. Tregs, aTreg, nTreg, proportion and the levels of IFN-γ, TNF-α, IL-17α, IL4, IL10 and TGF-β1 in the peripheral blood were measured, H&Y and MDS-UPDRS III scores were performed at the same time point before and after rTMS or sham treatment. B Tregs, and aTreg/nTreg proportion in the peripheral blood were assessed by flow cytometry prior to treatment and 1 day after the treatment. Hoehn and Yahr and MDS-UPDRS III were performed prior to treatment and on Days 13, 19, and 40 after the treatment. C No significant difference between the Mean H & Y ± SD on Days -1, 13, 19 and 40 in the sham and rTMS groups. (sham vs. rTMS groups on days -1: n = 27, P = 0.761, t = -0.306, d. f. = 52; sham vs. rTMS groups on days 13: n = 27, P = 0.761, t = -0.306, d. f. = 52; sham vs. rTMS groups on days 19: n = 27, P = 0.761, t = -0.306, d. f. = 52; sham vs. rTMS groups on days 40: n = 27, P = 0.761, t = -0.306, d. f. = 52). D There was a significant difference in the difference between the MDS-UPDRS III scores of the rTMS group and the sham group on day 13, 19, and 40 and their respective MDS-UPDRSIII scores on day -1.(rTMS vs. sham groups between days 13 and -1: n = 27, P < 0.0001, t = 15.64, d. f. = 208; rTMS vs. sham groups on 19 and -1: n = 27, P < 0.0001, t = 15.38, d. f. = 208; rTMS vs. sham groups on on 40 and -1: n = 27, P < 0.0001, t = 15.77, d. f. = 208). E The baseline of the proportion of CD4 + CD25 + CD127- Treg cells in the peripheral blood displays no significant difference between sham and rTMS group. (sham vs. rTMS groups: n = 27, P = 0.796, t = 0.26, d. f. = 52). F The peripheral blood CD4 + CD25 + CD127- Treg cells before and after sham rTMS treatment in the sham treatment group shows no significant difference. (before vs. after: n = 27, P = 0.185, t = 1.363, d. f. = 26). G The peripheral blood CD4 + CD25 + CD127-Treg cells before and after rTMS treatment in the rTMS treatment group shows significant difference. (before vs. after: n = 27, P < 0.000, t = -14.88, d. f. = 26). H Mean change in the proportion of Tregs/CD4 + T cells in the peripheral blood ± SD between days -1 and 13 in the sham and rTMS groups. (n = 27, P < 0.0001, t = 14.98, d. f. = 52). I No correlation between the change in the proportion of Tregs/CD4 + T cells and the change in MDS-UPDRSIII scores (between days -1 and 13) in sham group (n = 27, r2 = 0. 0007, p = 0.895). J Negative correlation between the change in the proportion of Tregs/CD4 + T cells. and the change in MDS-UPDRSIII scores (between days -1 and 13) in rTMS group. (n = 27, r2 = 0.8261, p < 0.0001). rTMS = repetitive transcranial magnetic stimulation; H & Y = Hoehn-Yahr; MDS UPDRS III = Movement Disorder Society Unified Parkinson's Disease Rating Scale part III; SD = Standard Deviation; Data are presented as mean ± SD; two-tailed unpaired t test (C, D, E, H); paired sample t test (F, G); linear regression analysis (I, J). ****P < 0.0001. Each data point represents an individual subject. Comparisons with no asterisk had a P > 0.05 and were considered not significant
Fig. 2
Fig. 2
rTMS treatment ameliorated behavioral impairments, increased the proportion of Tregs, suppressed the neuroinflammatory responses in MPTP-induced PD mice, and regulated the potential targets of Tregs. A Animal experimental design and rTMS treatment scheme to explore the role and mechanism of rTMS in the MPTP-induced PD mouse model. B Quantification of total the times for each group mice that spent in pole climbing test. (F8,99 = 8257, NC vs. NC + sham: P > 0.9999; NC vs. MPTP: P < 0.0001; NC + sham vs. NC + rTMS: P > 0.9999; MPTP vs. MPTP + sham: P > 0.9999; MPTP vs. MPTP + rTMS: P < 0.0001; MPTP + sham vs. MPTP + rTMS: P < 0.0001; MPTP vs. MPTP + block: P < 0.0001; MPTP + block + sham vs. MPTP + block + rTMS: P = 0.9494, n = 12 mice per group). C Flow cytometry–based analysis of CD3 + CD4 + CD25 + Foxp3 + Treg cells represen-tative fluorescence-activated cell sorting (FACS) plots of each group of mice. D The proportions of CD3 + CD4 + CD25 + Foxp3 + Treg cells/CD4 + T cells in the spleens of mice in each group. (F8, 45 = 608.8, NC vs. NC + sham: P > 0.9999; NC vs. MPTP: P < 0.0001; NC + sham vs. NC + rTMS: P = 0.9998; MPTP vs. MPTP + sham: P > 0.9999; MPTP vs. MPTP + rTMS: P < 0.0001; MPTP + sham vs. MPTP + rTMS: P < 0.0001; MPTP vs. MPTP + block: P < 0.0001; MPTP + block + sham vs. MPTP + block + rTMS: P > 0.9999, n = 6 mice per group). E Representative images of microglia in the SN. microglia were visualized by iba-1 staining. Scale bar, 50 μm. F Mean microglial immunostaining of Iba-1-positive cells in the SN in each group of mice ± SD. (F8, 81 = 1803, NC vs. NC + sham: P = 0.9985; NC vs. MPTP: P < 0.0001; NC + sham vs. NC + rTMS: P > 0.9999; MPTP vs. MPTP + sham: P = 0.9985; MPTP vs. MPTP + rTMS: P < 0.0001; MPTP + sham vs. MPTP + rTMS: P < 0.0001; MPTP vs. MPTP + block: P < 0.0001; MPTP + block + sham vs. MPTP + block + rTMS: P = 0.9985, n = 10 mice per group). G ELISA was used to analyze the protein expression of IL-10, TGF-β1, IL-6, IFN-γ, TNF-α and IL-1β in the ventral midbrain in each group of mice. (IL-1β: F8, 45 = 30,632, NC vs. NC + sham: P > 0.9999; NC vs. MPTP: P < 0.0001; NC + sham vs. NC + rTMS: P > 0.9999; MPTP vs. MPTP + sham: P > 0.9999; MPTP vs. MPTP + rTMS: P < 0.0001; MPTP + sham vs. MPTP + rTMS: P < 0.0001; MPTP vs. MPTP + block: P < 0.0001; MPTP + block + sham vs. MPTP + block + rTMS: P > 0.9999; IL-10: F8, 45 = 36,052, NC vs. NC + sham: P > 0.9999; NC vs. MPTP: P < 0.0001; NC + sham vs. NC + rTMS: P = 0.9894; MPTP vs. MPTP + sham: P = 0.9493; MPTP vs. MPTP + rTMS: P < 0.0001; MPTP + sham vs. MPTP + rTMS: P <  = 0.0001; MPTP vs. MPTP + block P < 0.0001; MPTP + block + sham vs. MPTP + block + rTMS: P = 0.9999; TNF-α: F8, 45 = 1767, NC vs. NC + sham: P > 0.9999; NC vs. MPTP: P < 0.0001; NC + sham vs. NC + rTMS: P > 0.9999; MPTP vs. MPTP + sham: P = 0.5829; MPTP vs. MPTP + rTMS: P < 0.0001; MPTP + sham vs. MPTP + rTMS: P < 0.0001; MPTP vs. MPTP + block: P < 0.0001; MPTP + block + sham vs. MPTP + block + rTMS: P > 0.9999; IL-6: F8, 45 = 7443, NC vs. NC + sham: P = 0.9987; NC vs. MPTP: P < 0.0001; NC + sham vs. NC + rTMS: P > 0.9999; MPTP vs. MPTP + sham: P = 0.7244; MPTP vs. MPTP + rTMS: P < 0.0001; MPTP + sham vs. MPTP + rTMS: P < 0.0001; MPTP vs. MPTP + block: P < 0.0001; MPTP + block + sham vs. MPTP + block + rTMS: P = 0.6587; IFN-γ: F8, 45 = 25,766, NC vs. NC + sham: P > 0.9999; NC vs. MPTP: P < 0.0001; NC + sham vs. NC + rTMS: P > 0.9999; MPTP vs. MPTP + sham: P = 0.9798; MPTP vs. MPTP + rTMS: P < 0.0001; MPTP + sham vs. MPTP + rTMS: P < 0.0001; MPTP vs. MPTP + block: P < 0.0001; MPTP + block + sham vs. MPTP + block + rTMS: P > 0.9999; TGF-β1: F8, 45 = 22,257, NC vs. NC + sham: P > 0.9999; NC vs. MPTP: P < 0.0001; NC + sham vs. NC + rTMS: P > 0.9999; MPTP vs. MPTP + sham: P > 0.9999; MPTP vs. MPTP + rTMS: P < 0.0001; MPTP + sham vs. MPTP + rTMS: P < 0.0001; MPTP vs. MPTP + block: P < 0.0001; MPTP + block + sham vs. MPTP + block + rTMS: P = 0.9998; n = 6 mice per group). SN = substantia nigra; LSD = least significant difference; MPTP = 1-methyl-4-phenyl-1, 2, 3, 6-tetrahydropyridine; NC = normal control; Data are presented as mean ± SD; One-way ANOVA with Fisher’s LSD multiple comparison post hoc test (B, D, E, G). ****P < 0.0001. Each data point represents an individual mouse. Comparisons with no asterisk had a P > 0.05 and were considered not significant
Fig. 3
Fig. 3
Quantitative proteomic analysis identified the Treg-related downstream targets Syt6, TLR4, TH and Slc6a3 that were associated with rTMS stimulation in PD. A Principal component analysis (PCA). The results showed an increased degree of aggregation among replicate samples and improved quantitative repeatability, with a large significant difference between the groups (n = 3, Con = saline normal control group, MPTP = MPTP-induced PD group, MPTP + rTMS = MPTP + rTMS treatment group, MPTP + block + rTMS = MPTP + Treg block + rTMS treatment group). B Heatmap showing the gene expression level per sample relative to the average expression of all samples. Red represents higher expression, and green represents lower expression (n = 3, Con = saline normal control group, MPTP = MPTP-induced PD group, MPTP + rTMS = MPTP + rTMS treatment group, MPTP + block + rTMS = MPTP + Treg block + rTMS treatment group). C All differentially expressed genes in each group were analyzed by intersection analysis, and two common differentially expressed genes, Slc6a3 and Syt6, were screened out (n = 3, Con = saline normal control group, MPTP = MPTP-induced PD group, MPTP + rTMS = MPTP + rTMS treatment group, MPTP + block + rTMS = MPTP + Treg block + rTMS treatment group). D Protein–protein interaction (PPI) network of differentially expressed proteins in the MPTP + rTMS and MPTP + block + rTMS groups (PPI enrichment p value < 1.0e-16); (n = 3, MPTP + rTMS = MPTP + rTMS treatment group, MPTP + block + rTMS = MPTP + Treg block + rTMS treatment group). E The SYT6 protein has a binding and interaction relationship with TLR4. F Representative western blot bands of the protein expression of Syt6, TLR4, TH, and Slc6a3 in the ventral midbrain of each group of mice. G Mean protein expression of Syt6, TLR4, TH, and Slc6a3 in the ventral midbrain in each group of mice ± SD. (Syt6: F8, 18 = 7696, NC vs. NC + sham: P > 0.9999; NC vs. MPTP: P < 0.0001; NC + sham vs. NC + rTMS: P > 0.9999; MPTP vs. MPTP + sham: P > 0.9999; MPTP vs. MPTP + rTMS: P < 0.0001; MPTP + sham vs. MPTP + rTMS: P < 0.0001; MPTP vs. MPTP + bock: P < 0.0001; MPTP + block + sham vs. MPTP + block + rTMS: P > 0.9999; TLR4: F8, 18 = 3511, NC vs. NC + sham: P > 0.9999; NC vs. MPTP: P < 0.0001; NC + sham vs. NC + rTMS: P > 0.9999; MPTP vs. MPTP + sham: P > 0.9999; MPTP vs. MPTP + rTMS: P < 0.0001; MPTP + sham vs. MPTP + rTMS: P < 0.0001; MPTP vs. MPTP + block: P < 0.0001; MPTP + block + sham vs. MPTP + block + rTMS: P = 0.9628; Slc6a3: F8, 18 = 626.5, NC vs. NC + sham: P > 0.9999; NC vs. MPTP: P < 0.0001; NC + sham vs. NC + rTMS: P > 0.9999; MPTP vs. MPTP + sham: P > 0.9999; MPTP vs. MPTP + rTMS: P < 0.0001; MPTP + sham vs. MPTP + rTMS: P < 0.0001; MPTP vs. MPTP + block: P < 0.0001; MPTP + block + sham vs. MPTP + block + rTMS: P > 0.9999; TH: F8, 18 = 334.50, NC vs. NC + sham: P = 0.9999; NC vs. MPTP: P < 0.0001; NC + sham vs. NC + rTMS: P = 0.9998; MPTP vs. MPTP + sham: P > 0.9999; MPTP vs. MPTP + rTMS: P < 0.0001; MPTP + sham vs. MPTP + rTMS: P < 0.0001; MPTP vs. MPTP + block: P < 0.0001; MPTP + block + sham vs. MPTP + block + rTMS: P > 0.9999, n = 3 mice per group). Data are presented as mean ± SD; One-way ANOVA with Fisher’s LSD multiple comparison post hoc test (G) ****P < 0.0001. Each data point represents an individual mouse. Comparisons with no asterisk had a P > 0.05 and were considered not significant
Fig. 4
Fig. 4
Screening out effective virus interference bands in syt6 to ensure interference efficiency. A Adeno-associated virus (AAV) vector was injected into midbrain via a stereotactic midbrain approach to block syt6 level. Pole climbing pole test, immunofluorescent staining and WB were used to detect the efficiency of transfection. B Quantification of total the times for each group mice that spent in pole climbing test. (F3,8 = 3691, MPTP + scramble vs. MPTP + syt6-shRNA1: P = 0.8070; MPTP + scramble vs. MPTP + syt6-shRNA2:P = 0.0022; MPTP + scramble vs. MPTP + syt6- shRNA3: P < 0.0001; n = 3 mice per group). C Immunofluorescent staining images of Syt6 expression in the SN of each group mice. Scale bar, 10 μm. D Quantitative analyses of Syt6 immunostaining in the SN. (F3,8 = 4701, MPTP + scramble vs. MPTP + syt6-shRNA1: P = 0.3061; MPTP + scramble vs. MPTP + syt6-shRNA2: P = 0.0040; MPTP + scramble vs. MPTP + syt6-shRNA3: P < 0.0001; n = 3 mice per group). E Representative western blot bands of the protein expression of Syt6 in the ventral midbrain of each group mice. F Quantitative analysis of the protein expression of Syt6 in the ventral midbrain of each group mice. (F3,8 = 275.9, MPTP + scramble vs. MPTP + syt6-shRNA1: P = 0.8026; MPTP + scramble vs. MPTP + syt6-shRNA2: P = 0.0018; MPTP + scramble vs. MPTP + syt6- shRNA3: P < 0.0001; n = 3 mice per group). Data are presented as mean ± SD; One-way ANOVA with Fisher’s LSD multiple comparison post hoc test (G). ****P < 0.0001, *P < 0.05. Each data point represents an individual mouse. Comparisons with no asterisk had a P > 0.05 and were considered not significant
Fig. 5
Fig. 5
Verification of the role of Treg and rTMS-related protein syt6 in MPTP mice by virus interference syt6 method. A Animal experimental design and virus interference syt6 scheme to explore the role of Treg and rTMS-related protein syt6 in the MPTP-induced PD mouse model. B Quantification of total the times for each group mice that spent in pole climbing test. (F7,112 = 18,690, NC + scramble + sham vs. NC + scramble + rTMS: P > 0.9999; NC + sramble + sham vs. MPTP + scramble + sham: P < 0.0001; NC + syt6-shRNA + sham vs. NC + syt6-shRNA + rTMS: P = 0.9999; MPTP + scramble + sham vs. MPTP + scramble + rTMS: P < 0.0001; MPTP + scramble + sham vs. MPTP + syt6-shRNA + sham: P < 0.0001; MPTP + syt6-shRNA + sham vs. MPTP + syt6-shRNA + rTMS: P = 0.9999, n = 15 mice per group). C Representative images of SYT6 expression in the SN. Scale bar, 10 μm. D Quantitative analyses of SYT6 immunostaining in the SN. (F7,72 = 2866, NC + scramble + sham vs. NC + scramble + rTMS: P > 0.9999; NC + scramble + sham vs. NC + syt6-shRNA + sham: P < 0.0001; NC + scramble + sham vs. MPTP + scramble + sham: P < 0.0001; NC + syt6-shRNA + sham vs. NC + syt6-shRNA + rTMS: P > 0.9999; MPTP + scramble + sham vs. MPTP + scramble + rTMS: P < 0.0001; MPTP + scramble + sham vs. MPTP + syt6-shRNA + sham: P < 0.0001; MPTP + syt6-shRNA + sham vs. MPTP + syt6- shRNA + rTMS: P > 0.9999, n = 10 mice per group). E Representative images of TH expression in the SN. Scale bar, 50 μm. F Quantitative analyses of TH immunostaining in the SN. (F7,72 = 649.7, NC + sramble + sham vs. NC + scramble + rTMS: P = 0.9426; NC + sramble + sham vs. NC + syt6-shRNA + sham: P < 0.0001; NC + scramble + sham vs. MPTP + scramble + shamm: P < 0.0001; NC + syt6-shRNA + sham vs. NC + syt6-shRNA + rTMS: P = 0.9993; MPTP + scramble + sham vs. MPTP + scramble + rTMS: P < 0.0001; MPTP + scramble + sham vs. MPTP + syt6-shRNA + sham: P < 0.0001; MPTP + syt6-shRNA + sham vs. MPTP + syt6- shRNA + rTMS: P > 0.9999, n = 10 mice per group). G Representative images of TLR4 expression in the SN. Scale bar, 10 μm. H Quantitative analyses of TLR4 immunostaining in the SN. (F7,72 = 1923, NC + sramble + sham vs. NC + scramble + rTMS: P > 0.9999; NC + scramble + sham vs. NC + syt6-shRNA + sham: P < 0.0001; NC + scramble + sham vs. MPTP + scramble + sha-m: P < 0.0001; NC + syt6-shRNA + sham vs. NC + syt6-shRNA + rTMS: P > 0.9999; MPTP + scramble + sham vs. MPTP + sramble + rTMS: P < 0.0001; MPTP + scramble + sham vs. MPTP + syt6-shRNA + sham: P < 0.0001; MPTP + syt6-shRNA + sham vs. MPTP + syt6- shRNA + rTMS: P > 0.9999, n = 10 mice per group). I ELISA was used to analyze the protein expression of IL-1β, TNF-α, IL-6, IL-10, TGF-β1 and IFN-γ in the ventral midbrain in each group of mice. (IL-1β: F7,40 = 6230, NC + scramble + sham vs. NC + scramble + rTMS: P = 0.9958; NC + scramble + sham vs. NC + syt6-shRNA + sham: P < 0.0001; NC + scramble + sham vs. MPTP + scramble + sham: P < 0.0001; NC + syt6-shRNA + sham vs. NC + syt6-shRNA + rTMS: P = 0.9279; MPTP + scramble + sham vs. MPTP + scramble + rTMS: P < 0.0001; MPTP + scramble + sham vs. MPTP + syt6-shRNA + sham: P < 0.0001; MPTP + syt6-shRNA + sham vs. MPTP + syt6-shRNA + rTMS: P = 0.9998; TNF-α: F7,40 = 347.7, NC + scramble + sham vs. NC + scramble + rTMS: P = 0.9651; NC + scramble + sham vs. NC + syt6-shRNA + sham: P < 0.0001; NC + scramble + sham vs. MPTP + scramble + sham: P < 0.0001; NC + syt6-shRNA + sham vs. NC + syt6-shRNA + rTMS: P > 0.9999; MPTP + scramble + sham vs. MPTP + scramble + rTMS: P < 0.0001; MPTP + scramble + sham vs. MPTP + syt6-shRNA + sham: P < 0.0001; MPTP + syt6-shRNA + sham vs. MPTP + syt6-shRNA + rTMS: P = 0.8441; IL-6: F7,40 = 1523, NC + scramble + sham vs. NC + scramble + rTMS: P = 0.8101; NC + scramble + sham vs. NC + syt6-shRNA + sham: P < 0.0001; NC + scramble + sham vs. MPTP + scramble + sham: P < 0.0001; NC + syt6-shRNA + sham vs. NC + syt6-shRNA + rTMS: P = 0.9999; MPTP + scramble + sham vs. MPTP + scramble + rTMS: P < 0.0001; MPTP + scramble + sham vs. MPTP + syt6-shRNA + sham: P < 0.0001; MPTP + syt6-RNA + sham vs. MPTP + syt6-shRNA + rTMS: P = 0.4726; IL-10: F7,40 = 4702, NC + scramble + sham vs. NC + scramble + rTMS:P > 0.9999; NC + scramble + sham vs. NC + syt6-shRNA + sham: P < 0.0001; NC + scramble + sham vs. MPTP + scramble + sham: P < 0.0001; NC + syt6-shRNA + sham vs. NC + syt6-shRNA + rTMS: P = 0.9894; MPTP + scramble + sham vs. MPTP + scramble + rTMS: P < 0.0001; MPTP + scramble + sham vs. MPTP + syt6-shRNA + sham: P < 0.0001; MPTP + syt6-shRNA + sham vs. MPTP + syt6-shRNA + rTMS: P = 0.9997; TGF-β1: F7,40 = 482.6, NC + scramble + sham vs. NC + scramble + rTMS: P > 0.9999; NC + scramble + sham vs. NC + syt6-shRNA + sham: P = 0.0004; NC + scramble + sham vs. MPTP + scramble + sham: P < 0.0001; NC + syt6-shRNA + sham vs. NC + syt6-shRNA + rTMS:P > 0.9999; MPTP + scramble + sham vs. MPTP + scramble + rTMS: P < 0.0001; MPTP + scramble + sham vs. MPTP + syt6-shRNA + sham: P < 0.0001; MPTP + syt6-shRNA + sham vs. MPTP + syt6-shRNA + rTMS: P > 0.9999; IFN-γ: F7,40 = 6016, NC + scramble + sham vs. NC + scramble + rTMS: P = 0.9784; NC + scramble + sham vs. NC + syt6-shRNA + sham: P < 0.0001; NC + scramble + sham vs. MPTP + scramble + sham: P < 0.0001; NC + syt6-shRNA + sham vs. NC + syt6-shRNA + rTMS: P > 0.9999; MPTP + scramble + sham vs. MPTP + scramble + rTMS: P < 0.0001; MPTP + scramble + sham vs. MPTP + syt6-shRNA + sham: P < 0.0001; MPTP + syt6-shR-NA + sham vs. MPTP + syt6-shRNA + rTMS: P = 0.9890; n = 6 mice per group). Data are presented as mean ± SD; One-way ANOVA with Fisher’s LSD multiple comparison post hoc test (B, D, F, H, I). ****P < 0.0001. Each data point represents an individual mouse. Comparisons with no asterisk had a P > 0.05 and were considered not significant

References

    1. Tan EK, Chao YX, West A, Chan LL, Poewe W, Jankovic J. Parkinson disease and the immune system - associations, mechanisms and therapeutics. Nat Rev Neurol. 2020;16(6):303–18. - PubMed
    1. Hirsch EC, Hunot S. Neuroinflammation in Parkinson’s disease: a target for neuroprotection? Lancet Neurol. 2009;8(4):382–97. - PubMed
    1. Geng L, Gao W, Saiyin H, Li Y, Zeng Y, Zhang Z, Li X, Liu Z, Gao Q, An P, et al. MLKL deficiency alleviates neuroinflammation and motor deficits in the α-synuclein transgenic mouse model of Parkinson’s disease. Mol Neurodegener. 2023;18(1):94. - PMC - PubMed
    1. Msackyi M, Chen Y, Tsering W, Wang N, Zhang H. Dopamine Release Neuroenergetics in Mouse Striatal Slices. Int J Mol Sci. 2024;25(9):4580. - PMC - PubMed
    1. Yang W, Chang Z, Que R, Weng G, Deng B, Wang T, Huang Z, Xie F, Wei X, Yang Q, et al. Contra-Directional Expression of Plasma Superoxide Dismutase with Lipoprotein Cholesterol and High-Sensitivity C-reactive Protein as Important Markers of Parkinson’s Disease Severity. Front Aging Neurosci. 2020;12:53. - PMC - PubMed

LinkOut - more resources