. 2024 Oct 26;22(1):659.
doi: 10.1186/s12951-024-02946-y.

Targeting FAP-positive chondrocytes in osteoarthritis: a novel lipid nanoparticle siRNA approach to mitigate cartilage degeneration

Affiliations

Targeting FAP-positive chondrocytes in osteoarthritis: a novel lipid nanoparticle siRNA approach to mitigate cartilage degeneration

Xiang Zhao et al. J Nanobiotechnology. .

Abstract

Background: Osteoarthritis (OA) is a common joint disease that leads to chronic pain and functional limitations. Recent research has revealed soluble fibroblast activation protein (FAP) secreted from OA synovium could degrade type II collagen (Col2) in cartilage to promote the progression of OA. This study aimed to reveal the role of FAP from chondrocytes in OA and develop a novel lipid nanoparticle (LNP)-FAP siRNA delivery system for OA treatment.

Methods: The expression of FAP in the cartilage of knee OA patients was investigated using [68 Ga]Ga-FAPI-04 PET in vivo and immunofluorescence, western blotting, and RT-qPCR in vitro. Cell senescence was determined by senescence-associated β-galactosidase (SA-β-Gal) assay after FAP overexpressing or knockdown in chondrocytes. An OA model with chondrocyte-specific FAP knockout mice was applied to investigate the role of FAP in chondrocyte senescence and OA development. The therapeutic effects of lipid nanoparticle (LNP) @FAP siRNA on cartilage degeneration were evaluated in the rat OA model.

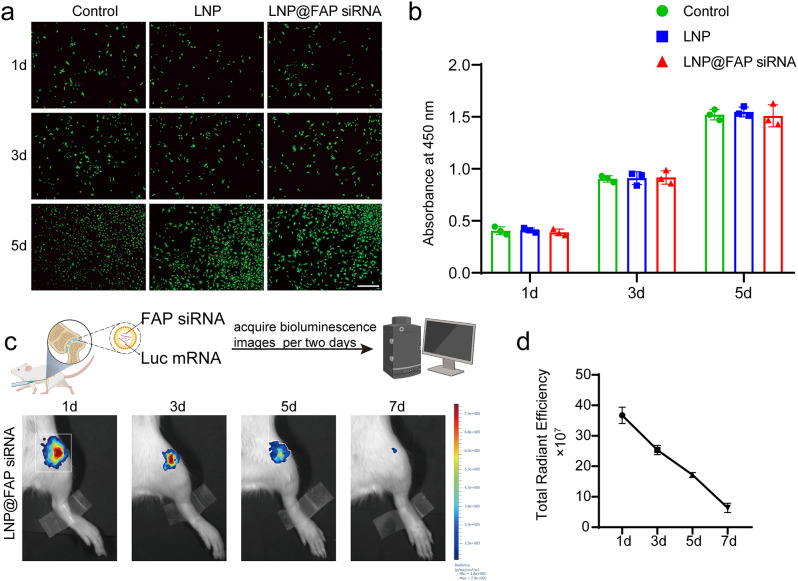
Results: Our study found that higher [68 Ga]Ga-FAPI-04 uptake was detected in knee OA patients by PET/CT scan. FAP mRNA and protein levels were highly expressed in OA-damaged cartilage. Moreover, we found that overexpression of FAP promotes chondrocyte senescence, and the genetic knockout of FAP in chondrocytes alleviates OA. Knockdown FAP by siRNA could alleviate chondrocyte senescence and suppress the NF-κB pathway to reduce the senescence-associated secretory phenotype (SASP). In the rat model of OA, intraarticular injection of LNP@FAP siRNA can reduce senescent cells and ameliorate cartilage destruction.

Conclusion: FAP-positive chondrocytes play a significant role in the pathogenesis of OA. Targeting these cells selectively has the potential to mitigate the progression of the disease. Our study provides valuable insights into the intraarticular injection of LNP@FAP siRNA as a promising strategy for the treatment of OA.

Keywords: FAP; LNP; Osteoarthritis; Senescence; [68 Ga]Ga-FAPI-04 PET/CT.


Conflict of interest statement

The authors declare no competing interests.

Figures

Fig. 1
Fig. 1
The acquisition and analysis of fundamental clinical data from knee OA patients. (a) Representative 68Ga-FAPI-04 PET/CT images of patients with KL scores ranging from 0 to 4. The statistical characteristics among distinct datasets of KL scores, age, and gender. (b) Patients with higher KL scores exhibited significantly increased uptake of 68Ga-FAPI-04, as indicated by higher SUVmax values (p<0.05). (c)While there was no significant difference in 68Ga-FAPI-04 uptake levels (SUVmax) observed between patients above and below the age of 70, (d) and between male and female patients (p>0.05)
Fig. 2
Fig. 2
FAP expression is significantly elevated in human OA articular cartilages. (a) A representative image of the area of intact and damaged articular cartilage was collected from total knee replacement of patients with OA. Black dashed boxes indicate respective intact and damaged areas. Safranin O staining of relatively healthy and osteoarthritis cartilages. Scale bar, 100 μm. (b) OARSI score of relatively healthy and OA cartilages. (c) Western blot analysis of FAP protein levels in intact and damaged cartilage. (d) Quantification of WB analysis (n = 3 for each group). (e) RT-qPCR analysis of FAP mRNA levels of the intact and damaged cartilage tissues. (f) The representative immunofluorescence staining of FAP in the chondrocytes from the intact and damaged cartilage tissues. Scale bar, 50 μm. (g) Percentage of FAP-positive chondrocytes in the articular of samples shown in (f). (h) The representative immunofluorescence staining of FAP and P21 in the cartilage tissues from the intact and damaged cartilage tissues. Scale bar, 100 μm. (i) Percentage of FAP and P21 double-labeled positive chondrocytes in the articular of samples shown in (h). (j) Dot plots showing the expression of FAP in damaged and intact cartilage samples on the UMAP map. (k) Bubble plot revealing function Gene Ontology (GO) terms highly enriched in the FAP-positive cells from the damaged cartilage samples. Data were presented as the mean ± SD (d, e, g, i) or median (25-75th percentiles) (b). P values are from two-tailed unpaired t-test (d, e, g, i) or Mann-Whitney U-test (b).* p < 0.05, *** p < 0.001,**** p < 0.0001.
Fig. 3
Fig. 3
Overexpression of FAP in chondrocytes contributes to chondrocyte senescence and cartilage degeneration. (a) The transfection efficiency of the Lv-FAP and Lv-NC to chondrocytes from SD rats. Scale bar, 100 μm. (b) Immunofluorescence images depicting FAP and SA-β-Gal staining in cultured chondrocytes from SD rats treated with either Lv-NC or Lv-FAP and quantitative analysis of the corresponding SA-β-Gal positive cells and FAP positive cells. Scale bar, 100 μm. (c) Western blot analysis of FAP and P21 protein levels of the cultured chondrocytes from SD rats treated with either Lv-NC or Lv-FAP at 3 and 6 days, respectively. (d) Representative images of T2-weighted MRI and T1-weighted MRI scans in Lv-FAP mice and Lv-NC mice in the sixth week. (e-h) Visualization of cartilage destruction and synovial inflammation in FAP-overexpression lentivirus-injected or NC lentivirus-injected mice at 6 weeks. SO&FG (e) and H&E staining (f) show cartilage destruction and synovial inflammation in Lv-FAP groups compared to Lv-NC groups. Additionally, quantification of the OARSI score (g) and synovitis score (h) is provided. Scale bar, 100 μm. (i, j) Immunofluorescence analysis was conducted to assess the expression levels of FAP and P21 in cartilage tissues from mice injected with FAP-overexpression lentivirus, as well as in those from the control group. Scale bar, 50 μm. Data were presented as the mean ± SD (a, b, c, j) or median (25-75th percentiles) (g, h). P values are from two-tailed unpaired t-test (a, b, c, j) or Mann-Whitney U-test (g, h). * p < 0.05, ** p < 0.01, *** p < 0.001. BF, bright field.
Fig. 4
Fig. 4
FAP deficiency in chondrocytes prevented OA development in mice. (a) Schematic diagram illustrating the experimental design. (b, d) The characteristic of cartilage destruction and synovial inflammation in both FAP cKO mice and FAPflox/flox mice post 6-week treatment by DMM surgery or sham control operation via SO/FG and H&E staining, respectively. Scale bar, 100 μm. (c, e) Quantification of the OARSI score and synovitis score. (f, g) The expression of P21 in cartilage tissues from both FAP cKO mice and FAPflox/flox mice (f) following 6 weeks of DMM surgery or sham control operation. Moreover, quantitatively analyze the expression of P21 at cellular levels. Scale bar, 50 μm. Data were presented as the mean ± SD (g) or median (25-75th percentiles) (c, e). P values are from one-way ANOVA (g) or Kruskal-Wallis H test (c, e). ** p < 0.01, *** p < 0.001.
Fig. 5
Fig. 5
Knocking down FAP can effectively alleviate the senescence of human OA chondrocytes. (a) Representative images of safranin O image showing cartilage degeneration in the intact and damaged cartilage tissues treated with PBS or Sitagliptin after 6 days. (b, c) Western blot analysis of Col2a1 protein levels of the intact and damaged cartilage tissues treated with PBS or Sitagliptin at 6 days and quantitative analysis. (d) Representative immunofluorescence images of FAP and SA-β-Gal staining in cultured chondrocytes from damaged cartilage tissues treated with FAP siRNA1 or FAP siRNA2. Scale bar, 50 μm. (e, f) Western blot analysis of FAP and P21 protein levels of the cultured chondrocytes from damaged cartilage tissues treated with FAP siRNA1 or FAP siRNA2 at 6 days and quantitative analysis. (g) RT-qPCR analysis of SASP mRNA levels, such as IL1β, IL6, TNFα, MMP3, MMP9, and MMP13, of the cultured chondrocytes from damaged cartilages treated with PBS or FAP siRNA. (h, i) Western blot analysis of nuclear factor kappa B (IKBα), P65 protein levels of the cultured chondrocytes from damaged cartilages treated with PBS or FAP siRNA at 6 days and quantitative analysis. Data were presented as the mean ± SD (c, f, g, i). P values are from two-tailed unpaired t-tests (c, f, g, i).* p < 0.05, ** p < 0.01, *** p < 0.001,**** p < 0.0001.
Fig. 6
Fig. 6
Characterization and siRNA transfection ability of LNPs. (a) Schematic of the nano-composites (LNP@FAP siRNA) synthesis. (b) The transfection efficiency of the LNPs with different synthesis ratios to chondrocytes from SD rats. Scale bar, 100 μm. (c) TEM image of the LNPs@FAP siRNA. Scale bar, 200 nm. (d) The size distribution of LNPs@FAP siRNA was determined by Dynamic Light Scattering (DLS). (e) The stability assessment of LNPs@FAP siRNA in a cell culture medium was performed over a 14-day period. (f) Mass spectrometry was performed to confirm the successful modification of FAP siRNA onto LNPs
Fig. 7
Fig. 7
Cytocompatibility and arthrography retention ability of LNPs. (a) Live/dead staining of the chondrocytes cultured with PBS, LNP, and LNP@FAP siRNA for 1, 3, and 5 days. Scale bar, 250 μm. (b) Cell counting kit-8 (CCK-8) assay of the chondrocytes cultured with PBS, LNP, and LNP@FAP siRNA for 1, 3, and 5 days. (c, d) To assay the FAP siRNA sustained release effect in vivo, we mixed FAP siRNA and luciferase mRNA (Luc mRNA) together and then formulated them with LNP. 5 µg of FAP siRNA per rat was injected into the left knee joint of rats, and bioluminescence images were sequentially acquired per two days, and the maximum signals were used for quantitative analysis.IVIS images for the rat after intra-articular injection with LNP@FAP siRNA with progress of time. Data are presented as means ± SD of at least three replicate experiments.
Fig. 8
Fig. 8
Attenuation of OA pathogenesis using intraarticular LNP@FAP siRNA in a rat ACLT OA model. (a) Schematic diagram illustrating the experimental design. (b) Axial and Coronal views of micro-CT images of the knee joints from the SD rat treated with LNP@FAP siRNA or LNP control after ACLT surgery or sham control operation after 6 weeks, respectively. (c, d) Quantitative analysis of structural parameters of knee joint subchondral bone: bone volume/tissue volume (BV/TV, %), and trabecular thickness (Tb. Th, mm). (e, f) Representative images of SO&FG and H&E staining showing cartilage destruction and synovial inflammation in the SD rat treated with either LNP@FAP siRNA of vehicle ACLT surgery or sham control operation following 6 weeks of treatment. Scale bar, 100 μm. (g, h) Quantification of the OARSI score and synovitis score. (i, j) The expression of Col2a1, FAP, and P21 in cartilage tissues and FAP in synovium from the SD rat treated with LNP@FAP siRNA of the vehicle after ACLT surgery or sham control operation duration of 6 weeks by immunofluorescence analysis. Scale bar, 50 μm. Data were presented as the mean ± SD (b, c, I, j, k, l) or median (25-75th percentiles) (e, g). P values are from one-way ANOVA (b, c, I, j, k, l) or Kruskal-Wallis H test (e, g). * p < 0.05, ** p < 0.01, *** p < 0.001.

References

    1. Katz JN, Arant KR, Loeser RF. Diagnosis and treatment of hip and knee osteoarthritis: a review. JAMA. 2021;325(6):568–78. - PMC - PubMed
    1. Weng Q, Chen Q, Jiang T, Zhang Y, Zhang W, Doherty M, Xie J, Liu K, Li J, Yang T, Wei J, Lei G, Zeng C. Global burden of early-onset osteoarthritis, 1990–2019: results from the global burden of Disease Study 2019. Ann Rheum Dis. 2024;83(7):915–25. - PubMed
    1. Long H, Liu Q, Yin H, Wang K, Diao N, Zhang Y, Lin J, Guo A. Prevalence trends of Site-Specific Osteoarthritis from 1990 to 2019: findings from the global burden of Disease Study 2019. Arthritis Rheumatol. 2022;74(7):1172–83. - PMC - PubMed
    1. Leifer VP, Katz JN, Losina E. The burden of OA-health services and economics. Osteoarthritis Cartilage. 2022;30(1):10–6. - PMC - PubMed
    1. Li S, Cao P, Chen T, Ding C. Latest insights in disease-modifying osteoarthritis drugs development. Ther Adv Musculoskelet Dis. 2023;15:1759720X231169839. - PMC - PubMed

MeSH terms

LinkOut - more resources