

Identification and validation of key extracellular proteins as the potential biomarkers in diabetic nephropathy
- PMID: 39456069
- PMCID: PMC11515200
- DOI: 10.1186/s40001-024-02120-y
Identification and validation of key extracellular proteins as the potential biomarkers in diabetic nephropathy
Abstract
Objective: Accumulation of extracellular matrix (ECM) proteins in the glomerular mesangial region is a typical hallmark of diabetic nephropathy (DN). However, the molecular mechanism underlying ECM accumulation in the mesangium of DN patients remains unclear. The present study aims to establish a connection between extracellular proteins and DN with the goal of identifying potential biomarkers for this condition.
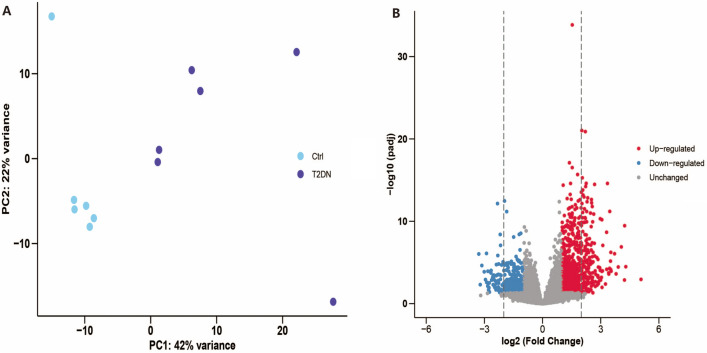
Methods: Differentially expressed genes (DEGs) between DN kidney tissue and healthy kidney tissue were analyzed using the public data GSE166239. Two gene lists encoding extracellular proteins were then utilized to identify extracellular protein-differentially expressed genes (EP-DEGs). Functional enrichment analyses, including Gene Ontology (GO) and Kyoto Encyclopedia of Genes and Genomes (KEGG) analyses, were performed on these EP-DEGs. A protein-protein interaction (PPI) network was established to identify key EP-DEGs. Furthermore, the diagnostic ability, immune cell infiltration, and clinical relevance of these EP-DEGs were investigated. Immunohistochemistry (IHC) staining of paraffin-embedded renal tissues was performed to validate the accuracy of the bioinformatic results.
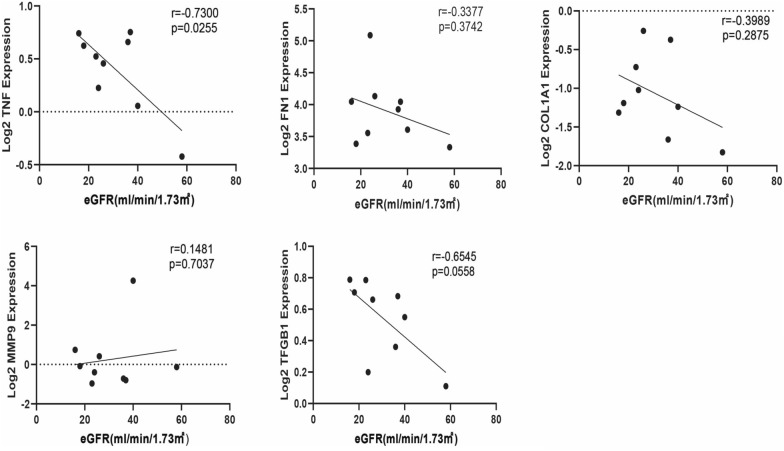
Results: A total of 1204 DEGs were identified, from which 162 EP-DEGs were further characterized by overlapping with extracellular protein gene lists. From the PPI network analysis, five EP-DEGs (e.g., TNF, COL1A1, FN1, MMP9, and TGFB1) were identified as candidate biomarkers. TNF, COL1A1, and MMP9 had a high diagnostic accuracy for DN. Assessment of immune cell infiltration revealed that the expression of TNF was positively associated with resting dendritic cells (DCs) (r = 0.85, P < 0.001) and M1 macrophages (r = 0.62, P < 0.05), whereas negatively associated with regulatory T cells (r = - 0.62, P < 0.05). Nephroseq v5 analysis demonstrated a negative correlation between the estimated glomerular filtration rate (eGFR) and TNF expression (r = - 0.730, P = 0.025). Gene set enrichment analysis (GSEA) revealed significant enrichment of glycosaminoglycan (GAG) degradation in the high-TNF subgroup. IHC staining of renal tissues confirmed significantly elevated TNF-a expression and decreased hyaluronic acid (HA) levels in the DN group compared to controls (both P < 0.05), with a negative correlation observed between TNF-a and HA (r = - 0.691, P = 0.026).
Conclusion: Our findings suggest that TNF may play a pivotal role in the progress of DN by driving ECM accumulation, and this process might involve GAG degradation pathway activation.
Keywords: Dendritic cell; Diabetic nephropathy; Extracellular matrix; Glycosaminoglycan degradation; TNF.
© 2024. The Author(s).
Conflict of interest statement
The authors declare no competing interests.
Figures


References
MeSH terms
Substances
LinkOut - more resources
Full Text Sources
Medical
Research Materials
Miscellaneous
