. 2024 Oct 25;15(1):31.
doi: 10.1186/s43008-024-00165-6.

Integration of fungal transcriptomics and metabolomics provides insights into the early interaction between the ORM fungus Tulasnella sp. and the orchid Serapias vomeracea seeds

Affiliations

Integration of fungal transcriptomics and metabolomics provides insights into the early interaction between the ORM fungus Tulasnella sp. and the orchid Serapias vomeracea seeds

Silvia De Rose et al. IMA Fungus. .

Abstract

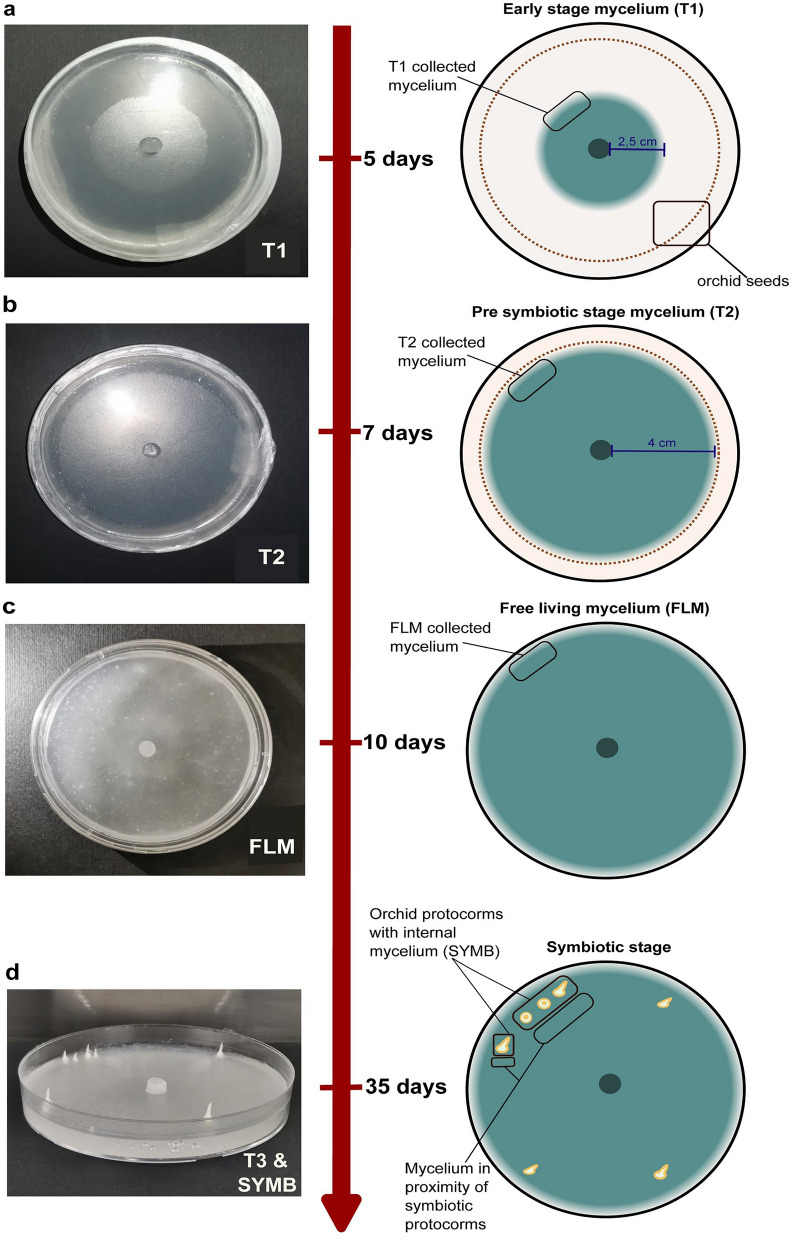
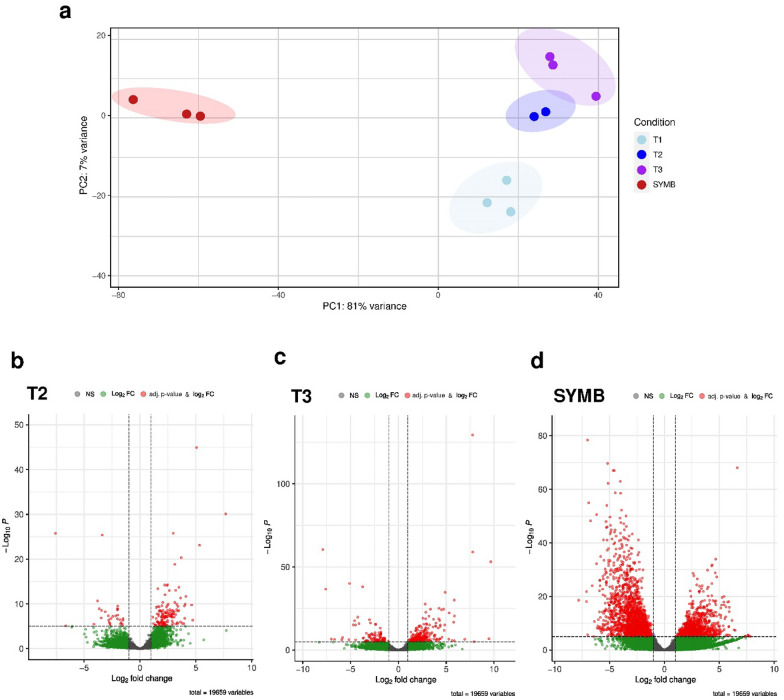
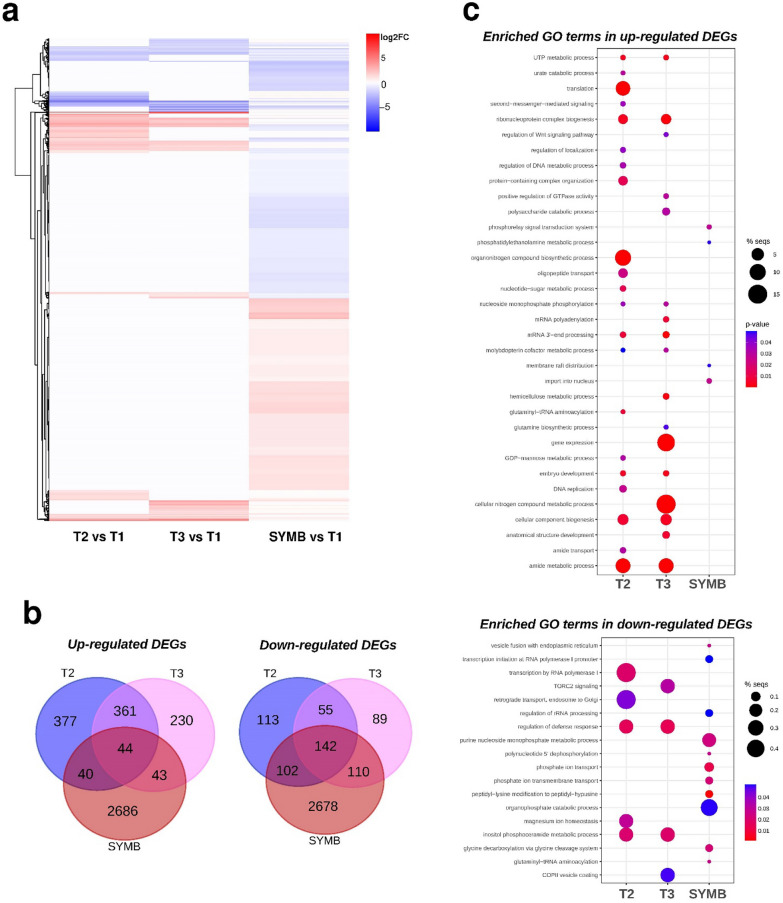
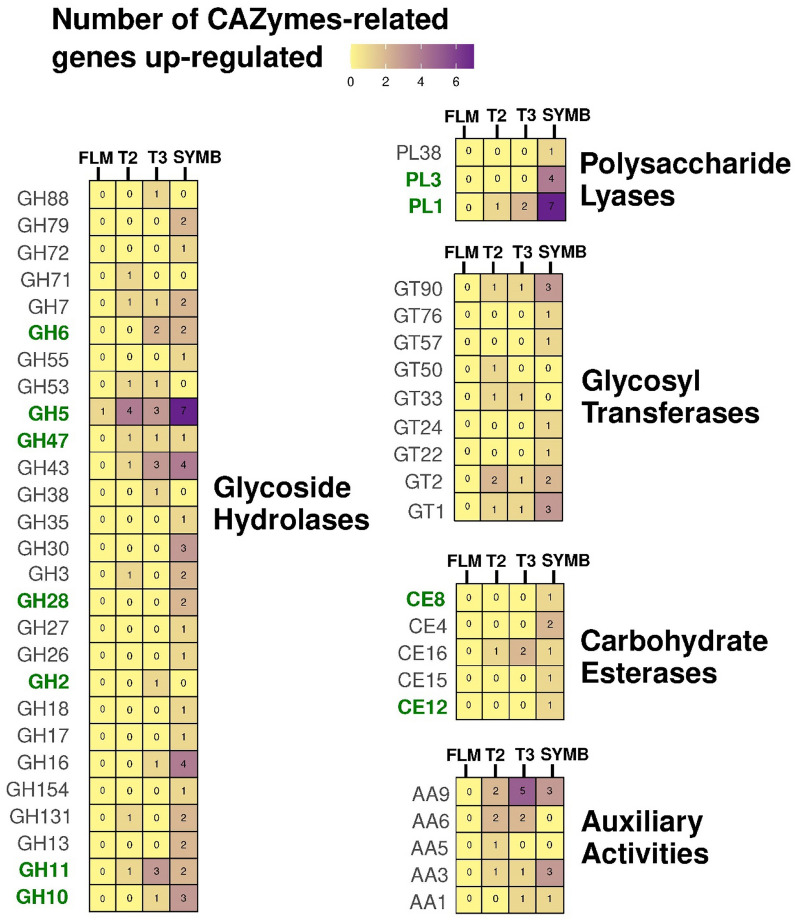
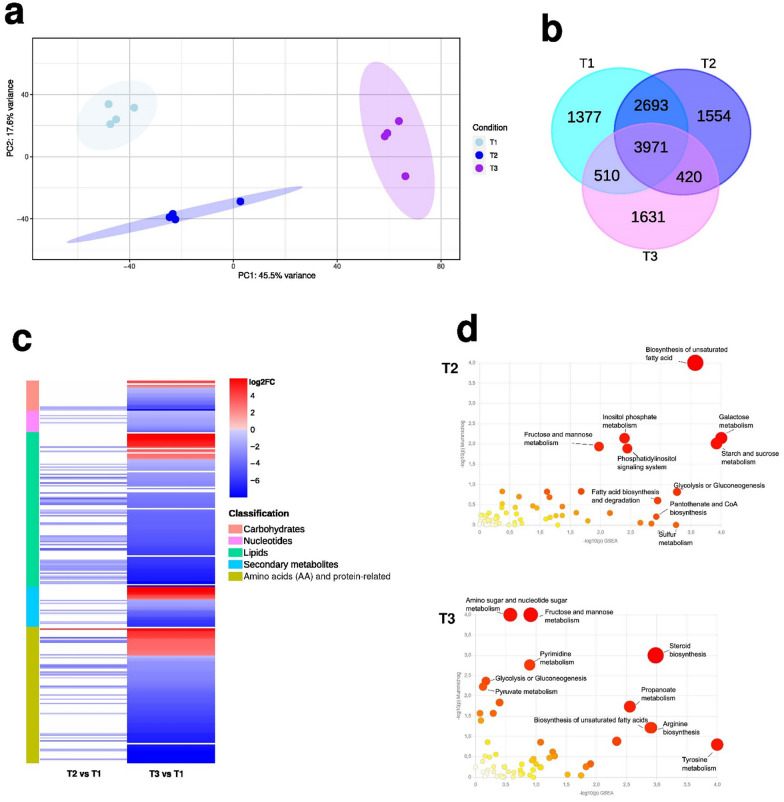
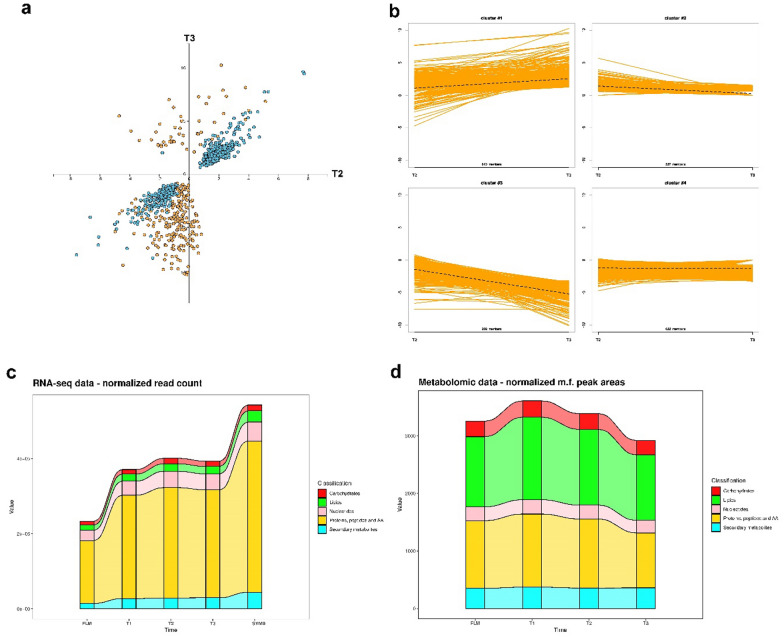
In nature, germination of orchid seeds and early plant development rely on a symbiotic association with orchid mycorrhizal (ORM) fungi. These fungi provide the host with the necessary nutrients and facilitate the transition from embryos to protocorms. Despite recent advances in omics technologies, our understanding of this symbiosis remains limited, particularly during the initial stages of the interaction. To address this gap, we employed transcriptomics and metabolomics to investigate the early responses occurring in the mycorrhizal fungus Tulasnella sp. isolate SV6 when co-cultivated with orchid seeds of Serapias vomeracea. The integration of data from gene expression and metabolite profiling revealed the activation of some fungal signalling pathways before the establishment of the symbiosis. Prior to seed contact, an indole-related metabolite was produced by the fungus, and significant changes in the fungal lipid profile occurred throughout the symbiotic process. Additionally, the expression of plant cell wall-degrading enzymes (PCWDEs) was observed during the pre-symbiotic stage, as the fungus approached the seeds, along with changes in amino acid metabolism. Thus, the dual-omics approach employed in this study yielded novel insights into the symbiotic relationship between orchids and ORM fungi and suggest that the ORM fungus responds to the presence of the orchid seeds prior to contact.

Keywords: CAZymes; Mycorrhizal fungi; Omics; Orchids; Symbiosis.


Conflict of interest statement

The authors declare that they have no competing interests.

Figures

Fig. 1
Fig. 1
Schematic representation of the sampling design for the time course experiment. Samples coded as T1 were collected at 5 days post inoculation (d.p.i) in plates (a), T2 at 7 d.p.i (b), FLM at 10 days after plug transfer in plates (c), T3 and SYMB at 35 d.p.i. (d)
Fig. 2
Fig. 2
RNA-seq results. In a, principal components analysis (PCA) of normalized read counts of all samples used in RNAseq experiment. In bd, Volcano plots showing identificed DEGs in T2, T3, SYMB, respectively, compared with T1 (control condition). Significant up-and down- regulated genes were represented by red dots (Log2FC > 1 and <  − 1, p adjusted value < 0.05). Green dots represented genes showing a Log2FC > 1 and <  − 1 and a not-significant p adjusted value (p adjusted value > 0.05). Grey dots represented genes showing both a Log2FC ranged from − 1 and 1, and a not-significant p-adjusted value (p adjusted value > 0.05)
Fig. 3
Fig. 3
Heatmap and Venn diagrams depicting DEGs in the conditions T2, T3 and SYMB versus T1, and GO analysis results. In a, heatmap and hierarchical clustering of DEGs using the McQuitty algorithm. The heatmap shows the expression patterns of DEGs across three conditions compared to T1, with red indicating up-regulated and blue representing down-regulated DEGs. Different color intensity indicates different levels of expression based on Log2FC. In b Venn diagrams illustrate the overlap of up- and down-regulated DEGs, respectively, between pairwise comparisons of the conditions. In c, bubble plots showing GO-enriched terms classified as Biological Process (BP) in detected up and down regulated DEGs. The x-axis shows the fold enrichment values, i.e., the percentage of genes in the selected DEG list belonging to a pathway divided by the corresponding percentage in the all reference gene list, and the y-axis reports the GO terms. Sizes of bubbles are proportional to the number of genes assigned to the related GO term, while bubbles color indicates the significance of the enriched term (False Discovery Rate values) as calculated by the enrichment analysis by Blast2GO
Fig. 4
Fig. 4
Number of CAZymes-related genes up-regulated in the three conditions. Color intensity is related to number of up-regulated genes corresponding to the five CAZYmes categories identified. Enzymes corresponding to PCWDEs are in bold and green colored
Fig. 5
Fig. 5
PCA, heatmap, and Venn diagrams depicting metabolites in the conditions T1, T2, T3, and functional analysis results. In a, PCA on detected metabolites in T1, T2, and T3. In b, the heatmap shows the expression patterns of metabolites in the two conditions T2 and T3 compared to T1, with red indicating up-regulated and blue representing down-regulated metabolites. Different color intensity indicates different relative amount based on Log2FC. In c Venn diagrams illustrate the overlap of detected mass features between pairwise comparisons of the conditions. In d, over-representation analysis shows enriched pathways (bubbles) in T2 and T3. Log10p-value of Mummichog and GSEA algorithms are represented by x and y axes, respectively
Fig. 6
Fig. 6
Integration of transcriptomic and metabolomic data. In a, scatterplot depicting the correlation of DEGs and metabolites (Log2FC) between T2 (x-axis) and T3 (y-axis). Blue dots represent DEGs, while yellow dots represent metabolites. In b, detected clusters through neural gas cluster analysis. In c and d, alluvial plots of normalized transcriptomic and metabolomic data across the different tested stages, respectively

Similar articles

Cited by

References

    1. Adamo M, Chialva M, Calevo J, De Rose S, Girlanda M, Perotto S, Balestrini R (2020) The Dark side of orchid symbiosis: can Tulasnella calospora decompose host tissues? Int J Mol Sci 21(9):3139. 10.3390/ijms21093139 - PMC - PubMed
    1. Almario J, Jeena G, Wunder J, Langen G, Zuccaro A, Coupland G, Bucher M (2017) Root-associated fungal microbiota of nonmycorrhizal Arabis alpina and its contribution to plant phosphorus nutrition. Proc Natl Acad Sci. 10.1073/pnas.1710455114 - PMC - PubMed
    1. Anders S, Pyl PT, Huber W (2014) HTSeq—a Python framework to work with high-throughput sequencing data. Bioinformatics 31(2):166–169. 10.1093/bioinformatics/btu638 - PMC - PubMed
    1. Atanasova L, Dubey M, Grujić M, Gudmundsson M, Lorenz C, Sandgren M, Kubicek CP, Jensen DF, Karlsson M (2018) Evolution and functional characterization of pectate lyase PEL12, a member of a highly expanded Clonostachys rosea polysaccharide lyase 1 family. BMC Microbiol. 10.1186/s12866-018-1310-9 - PMC - PubMed
    1. Balestrini R, Bonfante P (2014) Cell wall remodeling in mycorrhizal symbiosis: a way towards biotrophism. Front Plant Sci. 10.3389/fpls.2014.00237 - PMC - PubMed

LinkOut - more resources