. 2025 Jan;245(1):347-362.
doi: 10.1111/nph.20208. Epub 2024 Oct 25.

Cell-type-aware regulatory landscapes governing monoterpene indole alkaloid biosynthesis in the medicinal plant Catharanthus roseus

Affiliations

Cell-type-aware regulatory landscapes governing monoterpene indole alkaloid biosynthesis in the medicinal plant Catharanthus roseus

Chenxin Li et al. New Phytol. 2025 Jan.

Abstract

In plants, the biosynthetic pathways of some specialized metabolites are partitioned into specialized or rare cell types, as exemplified by the monoterpenoid indole alkaloid (MIA) pathway of Catharanthus roseus (Madagascar Periwinkle), the source of the anticancer compounds vinblastine and vincristine. In the leaf, the C. roseus MIA biosynthetic pathway is partitioned into three cell types with the final known steps of the pathway expressed in the rare cell type termed idioblast. How cell-type specificity of MIA biosynthesis is achieved is poorly understood. We generated single-cell multi-omics data from C. roseus leaves. Integrating gene expression and chromatin accessibility profiles across single cells, as well as transcription factor (TF)-binding site profiles, we constructed a cell-type-aware gene regulatory network for MIA biosynthesis. We showcased cell-type-specific TFs as well as cell-type-specific cis-regulatory elements. Using motif enrichment analysis, co-expression across cell types, and functional validation approaches, we discovered a novel idioblast-specific TF (Idioblast MYB1, CrIDM1) that activates expression of late-stage MIA biosynthetic genes in the idioblast. These analyses not only led to the discovery of the first documented cell-type-specific TF that regulates the expression of two idioblast-specific biosynthetic genes within an idioblast metabolic regulon but also provides insights into cell-type-specific metabolic regulation.

Keywords: idibioblast; single‐cell ATAC‐seq; single‐cell RNA‐seq; transcription factors; vinca alkaloids.


Conflict of interest statement

None declared.

Figures

Fig. 1
Fig. 1
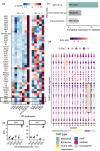
Cell‐type‐specific expression of monoterpene indole alkaloid (MIA) biosynthetic genes is recapitulated in a Catharanthus roseus leaf single‐cell multiome dataset. (a) Uniform Manifold Approximation and Projection (UMAP) of nuclei containing high‐quality RNA‐seq data (n = 8803), color coded by cell clusters. (b) Gene expression heatmap of C. roseus MIA biosynthetic genes across cell clusters detected in (a). Rows are biosynthetic genes and transporters, which are ordered from upstream to downstream. Asterisks denote matching cell‐type specificity with previously reported RNA in situ hybridization results. Color scale shows the average scaled expression of each gene at each cell cluster. Cell clusters are sorted by cell types. Dot size indicates the percentage of cells where a given gene is detected. The predicted cell type for each cell cluster is annotated by the color strip below the x‐axis. (c) UMAP of nuclei containing both high‐quality RNA‐seq and ATAC‐seq data (n = 3542 nuclei for all three UMAP), color coded by cell types. From left to right: UMAP based on gene expression assay, chromatin accessibility assay, and joint analysis.
Fig. 2
Fig. 2
A gene regulatory network for Catharanthus roseus monoterpene indole alkaloid biosynthetic genes integrating chromosome accessibility landscapes and transcription factor binding site profiles. (a, b) Coverage plot showing ATAC‐seq (upper panels) and DAP‐seq (lower panels) signals at the 7‐DLGT locus (a) and STR‐TCD‐SLTr biosynthetic gene cluster (b). Gray unfilled boxes highlight DAP‐seq peaks that overlap with ATAC‐seq peaks. Bottom track indicates the location and length of genes, where the direction of carets (> or <) indicates the strand of a gene. Halo: control DAP‐seq experiment using the halo tag (affinity tag) alone. (c) DNA motifs enriched in ORCA3/4‐binding sites, as well as a reference GCC box/ERF motif. E value = 2.1 × 10−75 for ORCA3 and E value = 1.8 × 10−96 for ORCA4. (d) A gene regulatory network integrating multiple modules of omics data and experimental data. Each node is a gene, color‐coded by the stage of the biosynthetic pathway. Each edge represents a regulatory relationship, color‐coded by the type of evidence supporting it. O, upregulated when the TF is overexpressed; Sc, co‐expressed across single cells; D, overlapping or within 2 kb to a DAP‐seq peak; A, DAP‐seq peak accessible; T, promoter activated in a transactivation assay.
Fig. 3
Fig. 3
Cell‐type‐specific accessible chromatin regions mark Catharanthus roseus late‐stage monoterpene indole alkaloid biosynthetic genes. (a, b) Coverage plot showing ATAC‐seq signals at the T16H216OMT gene pair (a) and DAT locus (b). Arrows highlight cell‐type‐specific ATAC‐seq peaks. Bottom track indicates the location and length of genes, where the direction of carets (> or <) indicates the strand of a gene. Grey boxes along the ‘Peaks’ track represent ATAC‐seq peaks. (c) Heat map showing accessibility of epidermis (Epi) and idioblast (Id) ATAC‐seq marker peaks across cell clusters. Each row is an ATAC‐seq peak. Each column is a cell cluster. Color scale is maxed out at 90th percentile of normalized ATAC‐seq signal. The predicted cell type for each cell cluster is annotated by the color strip below the x‐axis. (d) Transcription factor binding motifs overrepresented among idioblast marker peaks.
Fig. 4
Fig. 4
Gene co‐expression analysis across Catharanthus roseus leaf cell clusters discovered candidate WRKY and MYB transcription factors (TFs) specifically expressed in the idioblast. (a, b) Gene expression heatmap of WRKY TFs (a) and MYB TFs (b) across cell types. Color scales show the average scaled expression of each gene for each cell type. Dot size indicates the percentage of cells where a given gene is detected in each cell type. Only WRKY and MYB TFs detected in epidermis, internal phloem‐associated parenchyma (IPAP), or idioblast co‐expression modules are presented. Arrow indicates a single WRKY candidate (Idioblast WRKY1, IDW1: CRO_03G000120) specifically expressed in the idioblast. Box highlights three MYB candidates (Idioblast MYB1, IDM1: CRO_05G006800, Idioblast MYB2, IDM2: CRO_04G033370, Idioblast MYB3, IDM3: CRO_07G002170) specifically expressed in the idioblast.
Fig. 5
Fig. 5
Idioblast MYB1 (IDM1) activates the expression of D4H and DAT, as well as an idioblast‐specific transcriptional program in Catharanthus roseus. (a) Gene expression heatmap of the monoterpene indole alkaloid biosynthetic genes across overexpression treatments. Each row is a biosynthetic gene or transporter, ordered from upstream to downstream. Color scale represents scaled expression (z‐score). Combo: the combinatory treatment in which IDW1 and IDM1/2/3 are co‐infiltrated. (b) Mean separation plots showing expression levels of D4H and DAT (in units of transcripts per million) in the 0.4 optical density treatments. Each data point is a biological replicate. Error bars represent average and SE. Black × indicates average. (c) Bar graph showing percentage of genes that are most highly expressed in the idioblast. Expressed genes, all 18 523 expressed genes in this single‐cell multiome dataset; MYC2‐ORCA3, 3378 differentially expressed genes that are upregulated in the MYC2‐ORCA3 overexpression treatment; IDM1, 1057 differentially expressed genes that are upregulated in the 0.4 OD overexpression IDM1 treatment. (d) Gene expression heatmap of IDM1 metabolic regulon. Color scale shows the average scaled expression of each gene at each cell cluster. Dot size indicates the percentage of cells where a given gene is detected. The predicted cell type for each cell cluster is annotated by the color strip below the x‐axis. Box highlights genes specifically expressed in the idioblast.
Fig. 6
Fig. 6
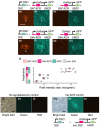
Transactivation assays for IDM1 against DAT and D4H promoters in Catharanthus roseus petals. (a, b) Reporter transactivation when agrobacterium strain carrying 35S:IDM1 and DAT reporter are co‐infiltrated. (c, d) Control samples when only the agrobacterium strain carrying the DAT reporter is infiltrated. (e, f) Reporter transactivation when agrobacterium strain carrying 35S:IDM1 and D4H reporter are co‐infiltrated. (g, h) Control samples when only the agrobacterium strain carrying the D4H reporter is infiltrated. (i) Quantification of microscope pixel intensity ratios. Color boxes on the right represent agrobacterium strains infiltrated. The first column indicates the reporter constructs (DAT, D4H, or minimal 35S promoter control). The second column indicates whether 35S:IDM1 is co‐infiltrated. Error bars represent average and SE. Pink × indicates average. (j–l) Microscope images of petals infiltrated with infiltration buffer (no agrobacterium control). No fluorescent signal can be detected in either the green or red channel. (m–o) Microscope images of petals co‐infiltrated with 35S:IDM1 and a control reporter without accessible chromatin region. No fluorescent signal can be detected in the red channel. Bars, 20 μm. ACR, accessible chromatin region.

References

    1. Bahieldin A, Atef A, Edris S, Gadalla NO, Al‐matary M, Al‐Kordy MA, Ramadan AM, Bafeel S, Alharbi MG, Al‐Quwaie DAH et al. 2018. Stepwise response of MeJA‐induced genes and pathways in leaves of C. roseus . Comptes Rendus Biologies 341: 411–420. - PubMed
    1. Bailey TL, Boden M, Buske FA, Frith M, Grant CE, Clementi L, Ren J, Li WW, Noble WS. 2009. Meme Suite: tools for motif discovery and searching. Nucleic Acids Research 37: W202–W208. - PMC - PubMed
    1. Bray NL, Pimentel H, Melsted P, Pachter L. 2016. Near‐optimal probabilistic RNA‐Seq quantification. Nature Biotechnology 34: 525–527. - PubMed
    1. Brown RL, Kazan K, McGrath KC, Maclean DJ, Manners JM. 2003. A role for the GCC‐Box in jasmonate‐mediated activation of the PDF1.2 gene of Arabidopsis. Plant Physiology 132: 1020–1032. - PMC - PubMed
    1. Burlat V, Oudin A, Courtois M, Rideau M, St‐Pierre B. 2004. Co‐expression of three MEP pathway genes and Geraniol 10‐Hydroxylase in internal phloem parenchyma of Catharanthus Roseus implicates multicellular translocation of intermediates during the biosynthesis of monoterpene indole alkaloids and isoprenoid‐derived primary metabolites. The Plant Journal 38: 131–141. - PubMed

MeSH terms

LinkOut - more resources