Review
. 2024 Oct 10;14(10):1278.
doi: 10.3390/biom14101278.

Structural and Dynamical Properties of Nucleic Acid Hairpins Implicated in Trinucleotide Repeat Expansion Diseases

Affiliations
Review

Structural and Dynamical Properties of Nucleic Acid Hairpins Implicated in Trinucleotide Repeat Expansion Diseases

Feng Pan et al. Biomolecules. .

Abstract

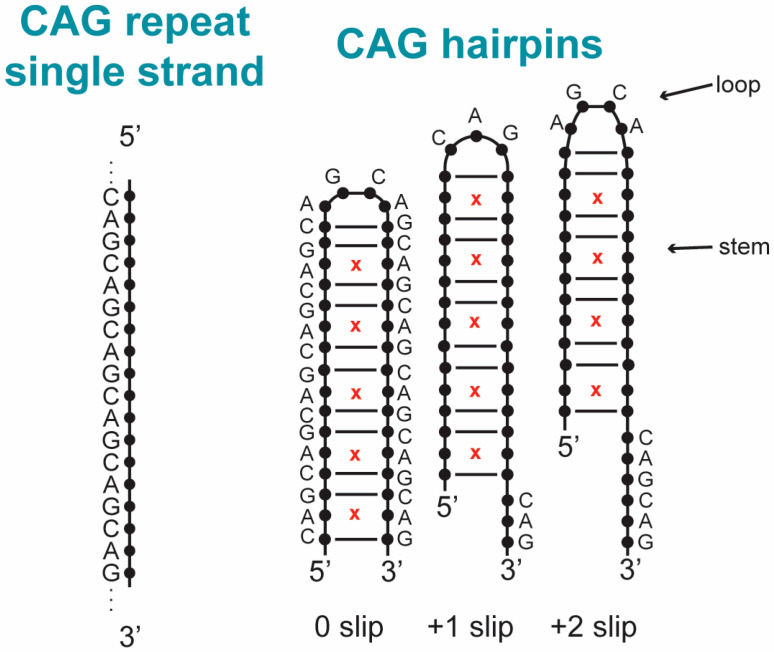
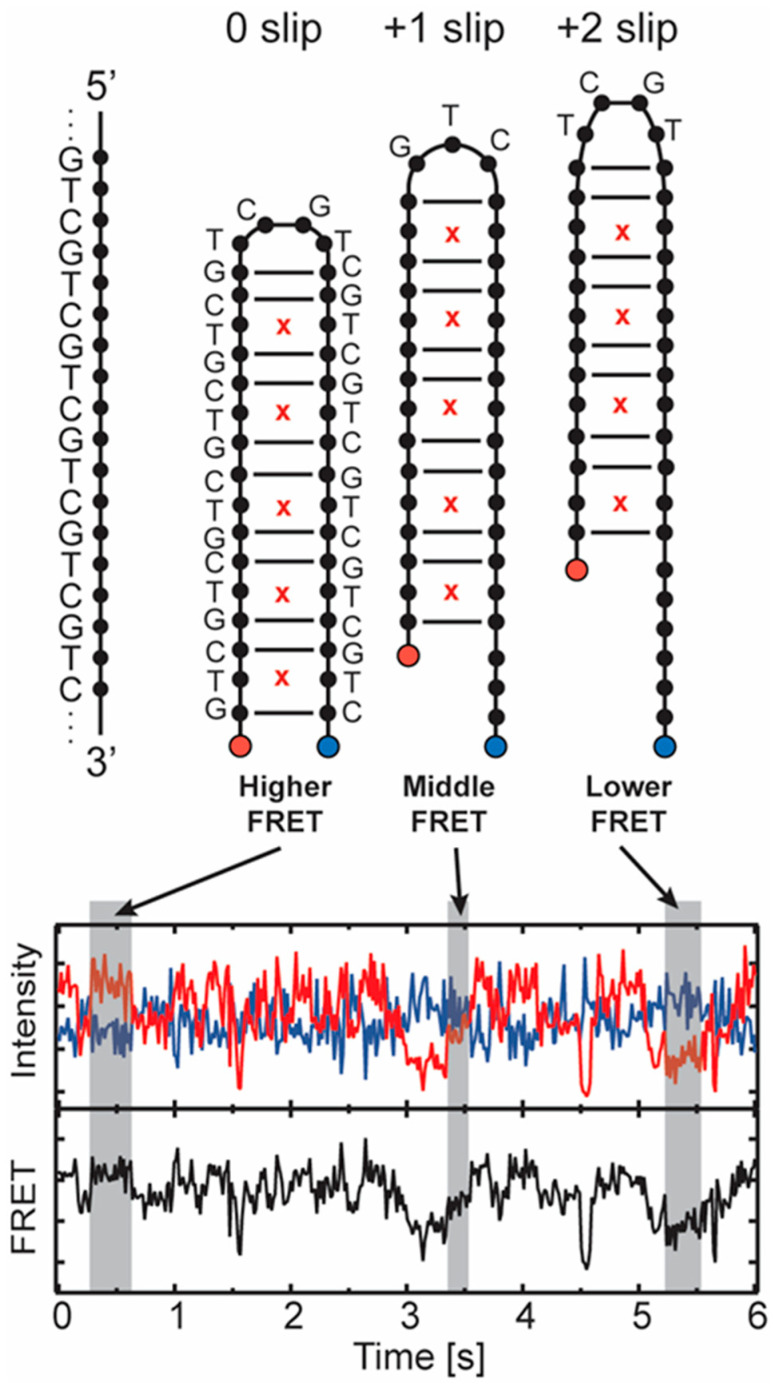
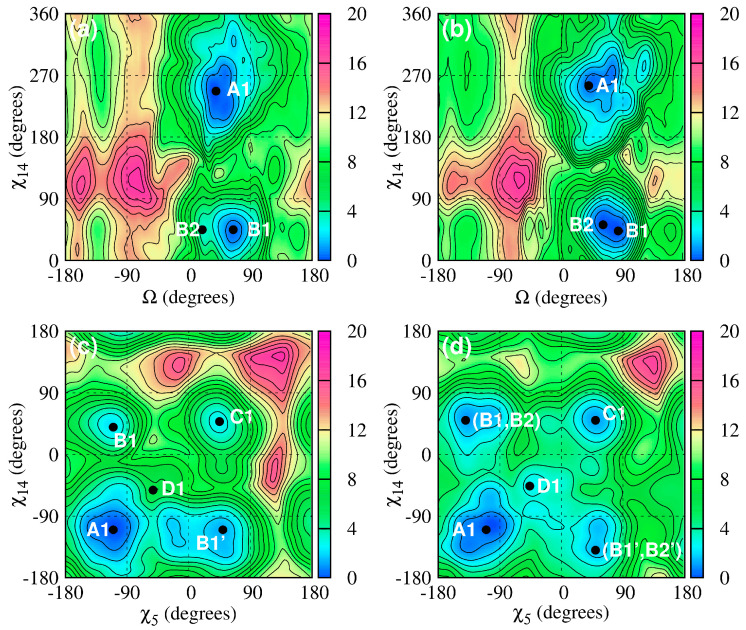
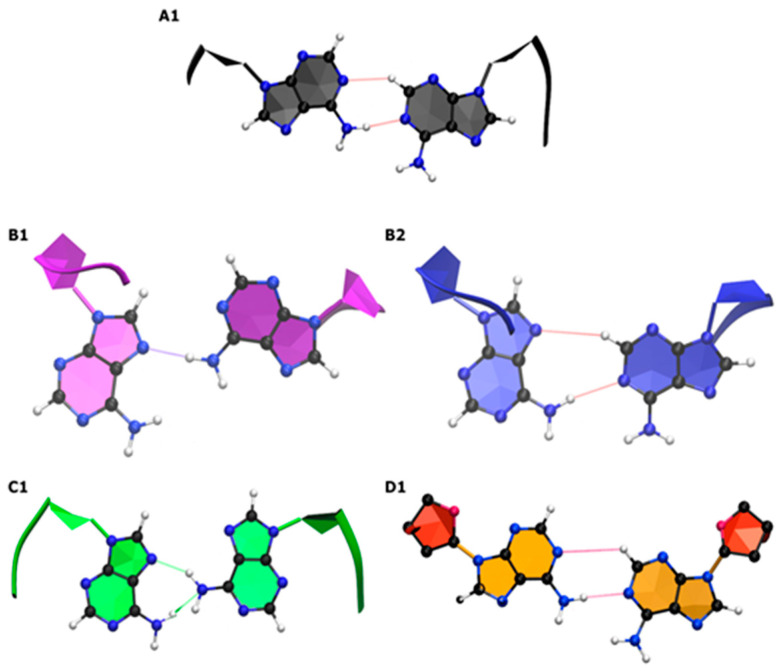
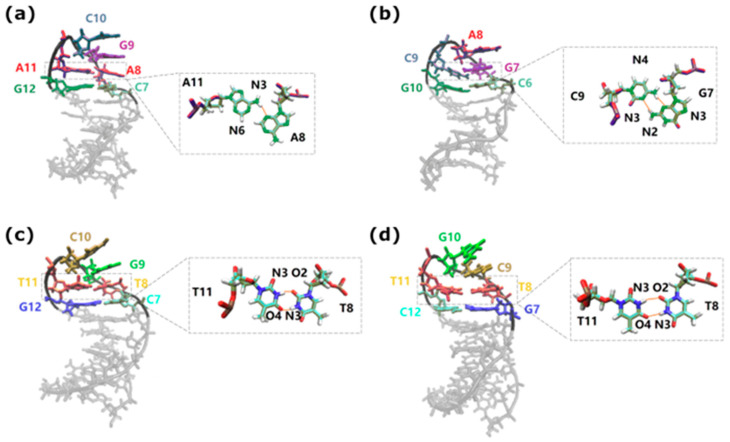
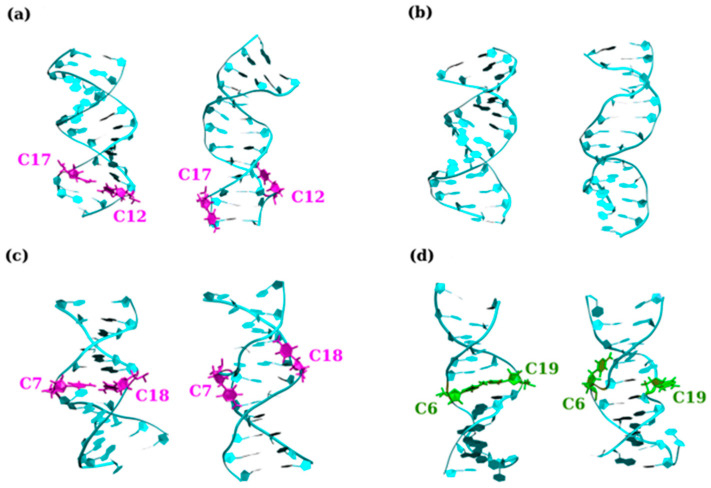
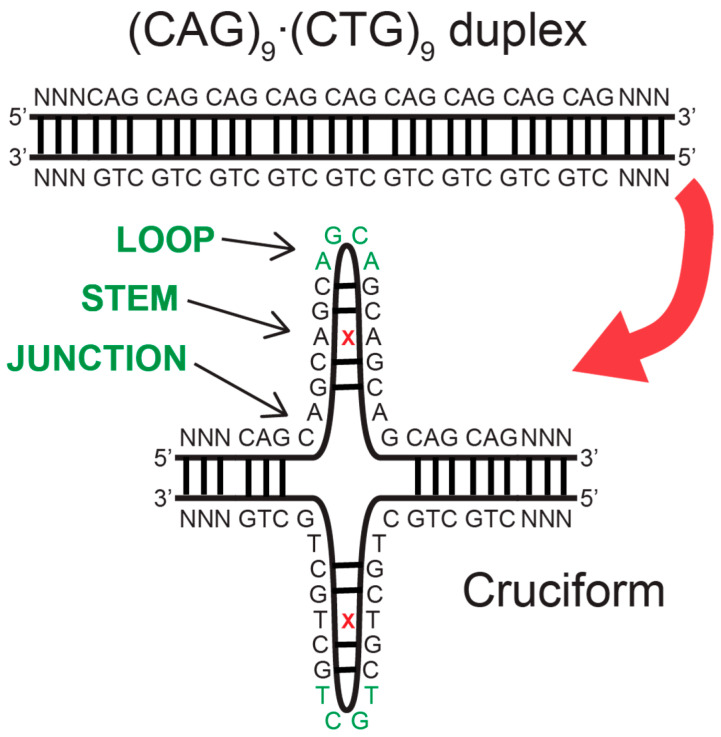
Dynamic mutations in some human genes containing trinucleotide repeats are associated with severe neurodegenerative and neuromuscular disorders-known as Trinucleotide (or Triplet) Repeat Expansion Diseases (TREDs)-which arise when the repeat number of triplets expands beyond a critical threshold. While the mechanisms causing the DNA triplet expansion are complex and remain largely unknown, it is now recognized that the expandable repeats lead to the formation of nucleotide configurations with atypical structural characteristics that play a crucial role in TREDs. These nonstandard nucleic acid forms include single-stranded hairpins, Z-DNA, triplex structures, G-quartets and slipped-stranded duplexes. Of these, hairpin structures are the most prolific and are associated with the largest number of TREDs and have therefore been the focus of recent single-molecule FRET experiments and molecular dynamics investigations. Here, we review the structural and dynamical properties of nucleic acid hairpins that have emerged from these studies and the implications for repeat expansion mechanisms. The focus will be on CAG, GAC, CTG and GTC hairpins and their stems, their atomistic structures, their stability, and the important role played by structural interrupts.

Keywords: CAG and GAC; CTG and GTC; expansion diseases; hairpin structure; molecular dynamics simulations; single-molecule FRET; smFRET; trinucleotide repeats.


Conflict of interest statement

The authors declare no conflicts of interest.

Figures

Figure 1
Figure 1
Examples of hairpins formed from CAG-repeat containing DNA. A single strand of CAG repeated DNA (left) can fold on itself to form hairpins (right). The stem is a duplex where a third of the base pairs are A–A mismatches (marked by red x) and the loop at the end includes unpaired bases. Three different states of the hairpin are displayed that are slipped in steps of a CAG unit indicated below the hairpin (leaving a short single strand overhang in this example). Some base labels are omitted for clarity. The stem base pairing pattern is maintained with slipped states. The loops illustrate that even and odd numbers of repeats in the stem result in tetraloops or triloops with 4 or 3 unpaired bases respectively.
Figure 2
Figure 2
Example of smFRET assay for detecting slipped states of trinucleotide repeat DNA hairpins. On the left, a single-strand GTC repeat DNA is illustrated. To the right, 3 slipped states of the GTC folded into a hairpin are displayed. The acceptor on the 5′ end is shown in red, and the donor is shown in blue. T–T mismatches are shown as red x. The sequence in the loop is shown to illustrate tetraloop and triloop states that associate with the parity of the slipped state, but the stem sequence is not shown for the +1 and +2 slipped states for clarity. The different slipped states result in different donor–acceptor separations and different FRET values as indicated. The example measured data trace (lower) shows donor intensity (blue), acceptor intensity (red), and FRET efficiency ratio (black) vs. time. See Refs. [123,124] for more information.
Figure 3
Figure 3
Shown here are sample free energy landscapes for a single A–A mismatch in a DNA-CAG and DNA-GAC. Here, (a) is (χ,Ω) for DNA-CAG; (b) (χ,Ω) for DNA-GAC; (c) (χ,χ) for DNA-CAG and (d) (χ,χ) for DNA-GAC. The letters mark the most important local minima with associated structures shown in Figure 4. The primed letters represent minima that are approximate mirror images of unprimed minima. Here, collective variable χ represents a dihedral angle of a given nucleotide and Ω an angle probing the motion of the nucleotide outside of its helical core. See Ref. [117] for more details.
Figure 4
Figure 4
Shown here are sample A–A mismatch conformations associated with the primary minima on the free energy landscapes of Figure 3 with letters denoting different conformations (indicated on Figure 3). Here, (A1) is associated with anti–anti; (B1,B2) with syn–anti; (C1) with syn–syn; and (D1) is a special case in which the χ-angle is syn-syn, but the base conformation appears anti-anti given the sugar ring twisting to be parallel to the bases. Hydrogen bonds associated with the configurations are marked. For more details, please see Ref. [117].
Figure 5
Figure 5
(a) A CAG tetraloop with the hairpin part in A(anti)–G(anti)–C(anti)–A(syn) form, with inset showing the hydrogen bond A8:N3-A11:N6 in the closing A–A mismatch. (b) GAC triloop with the hairpin part of G(anti)–A(anti)–C(syn) form, with inset showing the hydrogen bond G7:N2-C9:N3 and G7:N3-C9:N4 in the closing CG pair. (c) CTG tetraloop with the hairpin part in T(anti)–G(anti)–C(anti)–T(anti) with inset showing the hydrogen bond T8:N3-T11:N4 and T8:O2-T11:N3 in the closing T–T mismatch; (d) a GTC tetraloop with the hairpin part in T(anti)–G(anti)–C(syn)–T(anti) with inset showing the hydrogen bond T8:N3-T11:N4 and T8:O2-T11:N3 in the closing T–T mismatch. For more information, please see Refs. [123,124].
Figure 6
Figure 6
Sample configurations illustrating the e-motif as obtained with MD simulations. Initial (left) and final (right) structures are shown for (a) GCC4; (b) CCG4; (c) DC-1; and (d) DC-2. The C–C bases that ultimately form the e-motif are shown in purple. Bases shown in green are bases that are flipped out of the inner DNA helix but ultimately do not form an e-motif. See Ref. [122] for details.
Figure 7
Figure 7
Schematic of a trinucleotide repeat containing duplex DNA (upper) opening into a cruciform arrangement (lower). The loop, stem, and junction region of the hairpin loop in the cruciform are indicated. The mismatched base pair in the stem is indicated by the red x. See Ref. [124] for more information.

Similar articles

Cited by

References

    1. Wells R.D., Ashizawa T. Genetic Instabilities and Neurological Diseases. Elsevier; Boston, MA, USA: 2006.
    1. Ellegren H. Microsatellites: Simple Sequences with Complex Evolution. Nat. Rev. Genet. 2004;5:435–445. doi: 10.1038/nrg1348. - DOI - PubMed
    1. Kashi Y., King D., Soller M. Simple Sequence Repeats as a Source of Quantitative Genetic Variation. Trends Genet. 1997;13:74–78. doi: 10.1016/S0168-9525(97)01008-1. - DOI - PubMed
    1. Caburet S., Cocquet J., Vaiman D., Veitia R. Coding Repeats and Evolutionary “Agility”. BioEssays. 2005;27:581–587. doi: 10.1002/bies.20248. - DOI - PubMed
    1. Fleischer B. Uber mytotoische Dystrophie mit Katarakt. Albrecht Von Graefes Arch. Klin. Exp. Optalmol. 1918;96:905–914.

LinkOut - more resources