. 2024 Oct 14;14(10):1300.
doi: 10.3390/biom14101300.

Identification and Characterization of a Novel Insulin-like Receptor (LvRTK2) Involved in Regulating Growth and Glucose Metabolism of the Pacific White Shrimp Litopenaeus vannamei

Affiliations

Identification and Characterization of a Novel Insulin-like Receptor (LvRTK2) Involved in Regulating Growth and Glucose Metabolism of the Pacific White Shrimp Litopenaeus vannamei

Zijian Liu et al. Biomolecules. .

Abstract

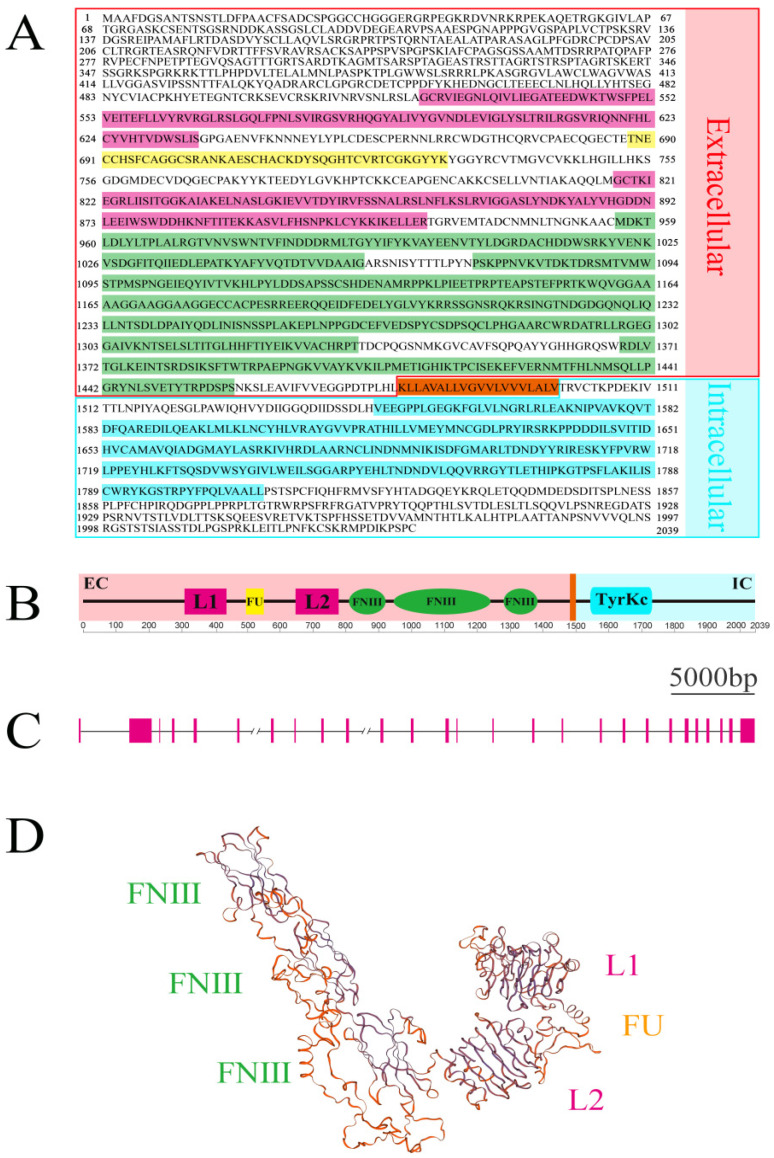
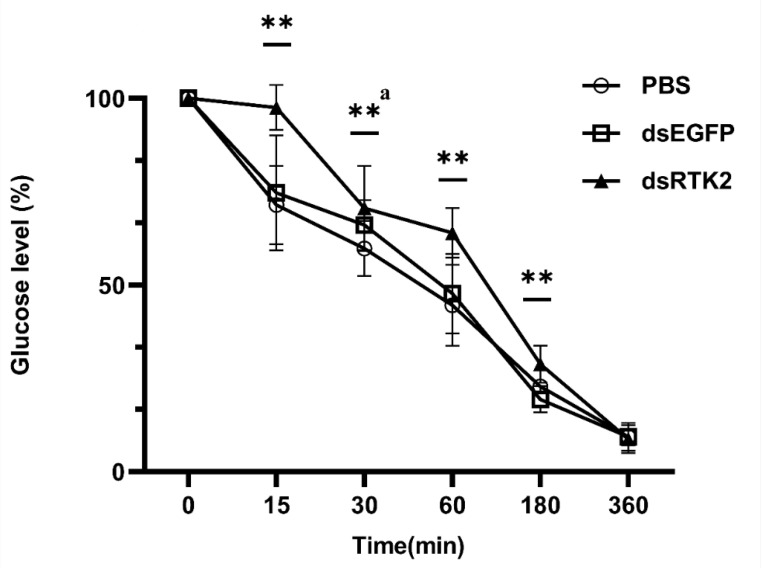
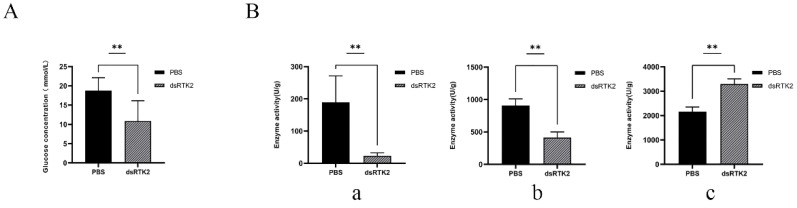
The insulin receptor (IR) plays a crucial role in the growth and metabolism of animals. However, there are still many questions regarding the IR in crustaceans, particularly their role in shrimp growth and glucose metabolism. In this study, we identified a novel insulin-like receptor gene in Litopenaeus vannamei and cloned its full length of 6439 bp. This gene exhibited a highly conserved sequence and structural characteristics. Phylogenetic analysis confirmed it as an unreported RTK2-type IR, namely, LvRTK2. Expression pattern analysis showed that LvRTK2 is primarily expressed in female reproductive and digestive organs. Through a series of in vivo and in vitro experiments, including glucose treatment, exogenous insulin treatment, and starvation treatment, LvRTK2 was confirmed to be involved in the endogenous glucose metabolic pathway of shrimp under different glucose variations. Moreover, long-term and short-term interference experiments with LvRTK2 revealed that the interference significantly reduced the shrimp growth rate and serum glucose clearance rate. Further studies indicated that LvRTK2 may regulate shrimp growth by modulating the downstream PI3K/AKT signaling pathway and a series of glucose metabolism events, such as glycolysis, gluconeogenesis, glycogen synthesis, and glycogenolysis. This report on the characteristics and functions of LvRTK2 confirms the important role of RTK2-type IRs in regulating shrimp growth and glucose metabolism.

Keywords: Litopenaeus vannamei; RNA interference; RTK2; glucose metabolism; growth regulation; insulin receptor.


Conflict of interest statement

The authors declare that this research was conducted in the absence of any commercial or financial relationships that could be construed as potential conflicts of interest.

Figures

Figure 12
Figure 12
Schematic pathway diagram of receptor tyrosine kinase (RTK) regulating the growth and glucose metabolism of L. vannamei. The pathway is drawn based on the Kyoto Encyclopedia of Genes and Genomes (KEGG) database (map04910) and our research findings. Lines ending with an arrow indicate promoting effects, while lines ending with a flat line indicate inhibitory effects. G6P: Glucose-6-phosphate, G1P: Glucose-1-phosphate, F6P: Fructose 6-Phosphate, FDP: Fructose Diphosphate, PGA: Phosphoglycerate, PEP: Phosphoenolpyruvate, PA: Pyruvic acid, OAA: Oxaloacetic acid.
Figure 1
Figure 1
Amino acid sequence and structural prediction of LvIR. (A) The derived amino acid sequence of LvIR, including two ligand-binding domains (highlighted with a purple background), one furin-like domain (yellow background), three FNⅢ domains (green background), one transmembrane domain (orange background), and one tyrosine kinase domain (blue background). The intracellular and extracellular regions are emphasized by blue and pink boxes, respectively. (B) Functional domain prediction of LvIR. The colors of the functional domains and transmembrane region are consistent with those in (A). (C) Exon-intron diagram of LvIR DNA. Pink boxes represent exons, and black horizontal lines represent introns. Double slashes indicate an unknown length. (D) Three-dimensional protein model of the extracellular region of LvIR. The locations of the corresponding functional domains are indicated.
Figure 2
Figure 2
Phylogenetic relationships of insulin-like receptors in decapoda crustacean. The numbers on the forks are the bootstrap proportions for each branch. The red arrow indicates LvRTK2 found in this study, and the red boxes represent the insulin-like receptors that have been reported.
Figure 3
Figure 3
Multiple sequence alignment of LvRTK2 with other decapoda RTK2 proteins. The IR sequences of Penaeus merguiensis (Pme), Penaeus chinensis (Pch), and Penaeus monodon (Pmo) are sourced from sequences predicted by NCBI. The asterisk (*) indicates conserved amino acids, the colon (:) indicates amino acids with conserved physicochemical properties, and the full stop (.) represents amino acids with weakly similar properties. The α chain, β chain, cleavage sequence, linked cysteine sites, transmembrane domain, ATP-binding site, and tyrosine kinase catalytic activity site are highlighted in different colors and boxes. Annotations are marked on the sides or below the figure.
Figure 4
Figure 4
Spatial and temporal expression profiles of LvRTK2. (A) Relative expression levels of LvRTK2 in sixteen adult tissues, including oviduct (Ovi), ovary (Ova), ventral nerve cord (Ven), gut (Gut), stomach (Sto), vas deferens (Vas), sperm atophore (Spe), hepatopancreas (Hep), testis (Tes), eyestalk (Eye), epidermis (Epi), gill (Gil), thoracic ganglia (Tho), heart (Hea), hemocyte (Hem), and muscle (Mus). The number of biological replicates per tissue is six, with three biological replicates (n = 18). The error bars for each column represent standard deviations. (B) FPKM value of LvRTK2 at nine early developmental stages, including the zygote (Zyg), blastula (Bla), gastrula (Gas), limb bud embryo (Lim), nauplius (Nau), zoea (Zoe), mysis (Mys), and post-larvae (Pos) stages. (C) FPKM value of LvRTK2 at eight molting stages, including the inter-molt (C stage), pre-molt (D0, D1, D2, D3, and D4 stages), and post-molt (P1 and P2 stages) stages.
Figure 5
Figure 5
Effects of glucose treatment on glucose levels and LvRTK2 expression. (A) Changes in serum glucose concentration after in vivo glucose injection. (B) Log2 fold changes of LvRTK2 expression between the experimental and control groups after glucose injection. Red indicates upregulation and blue indicates downregulation. (C) Images of primary hepatopancreatic cells treated. (D) Changes in LvRTK2 expression under in vitro glucose treatment between the control group (CG) and experimental group (EG). Error bars represent standard deviation. Statistical significance is indicated as * p < 0.05 and ** p < 0.01.
Figure 6
Figure 6
Effects of exogenous insulin treatment on glucose levels and LvRTK2 expression. (A) Changes in serum glucose concentration after in vivo exogenous insulin injection. (B) Log2 fold changes of LvRTK2 expression between the experimental and control groups after exogenous insulin injection. Red indicates up-regulation and blue indicates down-regulation. (C) Images of primary hepatopancreatic cells treated. (D) Changes in LvRTK2 expression under in vitro exogenous insulin treatment between the control group (CG) and experimental group (EG). Error bars represent standard deviation. Statistical significance is indicated as * p < 0.05 and ** p < 0.01.
Figure 7
Figure 7
Effects of starvation treatment on glucose levels and LvRTK2 expression. (A) Changes in serum glucose concentration after in vivo starvation treatment. (B) Log2 fold changes of LvRTK2 expression between the experimental and control groups after starvation treatment. Red indicates up-regulation and blue indicates down-regulation. (C) Images of primary hepatopancreatic cells treated. There is a significant decrease in cell density in the experimental group compared to the control group after 24 h of treatment. (D) Changes in LvRTK2 expression under in vitro starvation treatment between the control group (CG) and experimental group (EG). Error bars represent standard deviation. Statistical significance is indicated as * p < 0.05 and ** p < 0.01.
Figure 8
Figure 8
Measurement of shrimp body weight under long-term LvRTK2 interference. (A) Results of average body weight measurement. The asterisk symbol (**) indicates that there are significant differences between the dsRTK2 group and both the dsEGFP group and the PBS group (p < 0.01). (B) Representative photo showing differences in shrimp size between the experimental group and the control group after 20 days interference. The selected shrimp represent the average body weight. Error bars indicate standard deviation, with statistical significance as ** p < 0.01.
Figure 9
Figure 9
Measurement of serum glucose levels under short-term LvRTK2 interference. To present the results visually, the glucose concentration at the initial time is normalized to 100%, and the data for the remaining time points are correspondingly homogenized. Error bars represent the standard deviation. The statistical significance was ** p < 0.01 (where ‘a’ indicates that the dsRTK2 group data only show a significant difference compared to the control group).
Figure 10
Figure 10
Measurement of glucose concentration and enzyme activity in the hepatopancreas after long-term LvRTK2 interference. (A) Changes in glucose concentration in hepatopancreas between the control group (PBS) and the interference group (dsRTK2). (B) Differences in the activity of glucose metabolism-related enzymes. (a): HK, (b): PFK, and (c): PEPCK. Error bars represent standard deviation. The statistical significance was ** p < 0.01.
Figure 11
Figure 11
Measurement of downstream gene expression in the hepatopancreas after long-term LvRTK2 interference. The changes in relative expression levels of genes including (A): PI3K, (B): PDK1, (C): AKT, (D): FOXO, (E): GLUT, (F): HK, (G): G6PI, (H): PGK, (I): PK, (J): G6PC, (K): FBP, (L): PEPCK, (M): PC, (N): GSK, and (O): GYS were measured. Error bars refer to the standard deviation. Statistical significance is marked as * p < 0.05 and ** p < 0.01.

References

    1. Saltiel A.R. Handbook of Experimental Pharmacology. Volume 233. Springer; Cham, Switzerland: 2016. Insulin signaling in the control of glucose and lipid homeostasis; pp. 51–71. - PubMed
    1. Vecchio I., Tornali C., Bragazzi N.L., Martini M. The discovery of insulin: An important milestone in the history of medicine. Front. Endocrinol. 2018;9:613. doi: 10.3389/fendo.2018.00613. - DOI - PMC - PubMed
    1. Wilson L.M., Castle J.R. Recent advances in insulin therapy. Diabetes Technol. Ther. 2020;22:929–936. doi: 10.1089/dia.2020.0065. - DOI - PMC - PubMed
    1. Doležel D., Hanus R., Fiala I., Beneš V., Vaněčková H., Horák A., Lukšan O., Jedlička P., Bazalová O., Provazník J., et al. Complex evolution of insect insulin receptors and homologous decoy receptors, and functional significance of their multiplicity. Mol. Biol. Evol. 2020;37:1775–1789. - PMC - PubMed
    1. Bedinger D.H., Adams S.H. Metabolic, anabolic, and mitogenic insulin responses: A tissue-specific perspective for insulin receptor activators. Mol. Cell. Endocrinol. 2015;415:143–156. doi: 10.1016/j.mce.2015.08.013. - DOI - PubMed

LinkOut - more resources