Effect of Spicatoside a on Anti-Osteosarcoma MG63 Cells through Reactive Oxygen Species Generation and the Inhibition of the PI3K-AKT-mTOR Pathway
- PMID: 39456416
- PMCID: PMC11505237
- DOI: 10.3390/antiox13101162
Effect of Spicatoside a on Anti-Osteosarcoma MG63 Cells through Reactive Oxygen Species Generation and the Inhibition of the PI3K-AKT-mTOR Pathway
Abstract
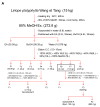
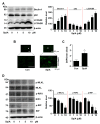
Osteosarcoma is a primary malignant tumor found in the bones of children and adolescents. Unfortunately, many patients do not respond well to treatment and succumb to the illness. Therefore, it is necessary to discover novel bioactive compounds to overcome therapeutic limitations. Liriope platyphylla Wang et Tang is a well-known herb used in oriental medicine. Studies have shown that metabolic diseases can be clinically treated using the roots of L. platyphylla. Recent studies have demonstrated the anticarcinoma potential of root extracts; however, the exact mechanism remains unclear. The aim of this study was to examine the anti-osteosarcoma activity of a single compound extracted from the dried roots of L. platyphylla. We purified Spicatoside A (SpiA) from the dried roots of L. platyphylla. SpiA significantly inhibited the proliferation of human osteosarcoma MG63 cells in a dose- and time-dependent manner. SpiA also regulated the expression of various downstream proteins that mediate apoptosis (PARP, Bcl-2, and Bax), cell growth (cyclin D1, Cdk4, and Cdk6), angiogenesis (VEGF), and metastasis (MMP13). The Proteome Profiler Human Phospho-Kinase Array Kit showed that the AKT signaling protein was a target of SpiA in osteosarcoma cells. We also found that SpiA suppressed the constitutive activation of the PI3K-AKT-mTOR-p70S6K1 signaling pathway. We further validated the effects of SpiA on the AKT signaling pathway. SpiA induced autophagosome formation and suppressed necroptosis (a form of programmed cell death). SpiA increased the generation of reactive oxygen species (ROS) and led to the loss of mitochondrial membrane potential. N-acetylcysteine (NAC)-induced inhibition of ROS generation reduced SpiA-induced AKT inhibition, apoptotic cell death, and anti-metastatic effects by suppressing cell migration and invasion. Overall, these results highlight the anti-osteosarcoma effect of SpiA by inhibiting the AKT signaling pathway through ROS generation, suggesting that SpiA may be a promising compound for the treatment of human osteosarcoma.
Keywords: AKT; ROS; Spicatoside A; apoptosis; autophagy; necroptosis; osteosarcoma.
Conflict of interest statement
The authors declare no competing financial interests.
Figures


Similar articles
-
Vitexicarpin Induces Apoptosis and Inhibits Metastatic Properties via the AKT-PRAS40 Pathway in Human Osteosarcoma.Int J Mol Sci. 2024 Mar 22;25(7):3582. doi: 10.3390/ijms25073582. Int J Mol Sci. 2024. PMID: 38612399 Free PMC article.
-
Pro-apoptotic and pro-autophagic effects of the Aurora kinase A inhibitor alisertib (MLN8237) on human osteosarcoma U-2 OS and MG-63 cells through the activation of mitochondria-mediated pathway and inhibition of p38 MAPK/PI3K/Akt/mTOR signaling pathway.Drug Des Devel Ther. 2015 Mar 12;9:1555-84. doi: 10.2147/DDDT.S74197. eCollection 2015. Drug Des Devel Ther. 2015. PMID: 25792811 Free PMC article.
-
Diallyl trisulfide induces osteosarcoma cell apoptosis through reactive oxygen species-mediated downregulation of the PI3K/Akt pathway.Oncol Rep. 2016 Jun;35(6):3648-58. doi: 10.3892/or.2016.4722. Epub 2016 Apr 1. Oncol Rep. 2016. PMID: 27035545
-
Eldecalcitol induces apoptosis and autophagy in human osteosarcoma MG-63 cells by accumulating ROS to suppress the PI3K/Akt/mTOR signaling pathway.Cell Signal. 2021 Feb;78:109841. doi: 10.1016/j.cellsig.2020.109841. Epub 2020 Nov 18. Cell Signal. 2021. PMID: 33217539
-
MicroRNA‑22 mediates the cisplatin resistance of osteosarcoma cells by inhibiting autophagy via the PI3K/Akt/mTOR pathway.Oncol Rep. 2020 Apr;43(4):1169-1186. doi: 10.3892/or.2020.7492. Epub 2020 Feb 7. Oncol Rep. 2020. PMID: 32323781 Free PMC article.
Cited by
-
Cancer-associated Fibroblast-like Cells Promote Osteosarcoma Metastasis by Upregulation of Phosphoserine Aminotransferase 1 and Activation of the mTOR/S6K Pathway.Int J Biol Sci. 2025 Jun 20;21(9):4153-4171. doi: 10.7150/ijbs.109169. eCollection 2025. Int J Biol Sci. 2025. PMID: 40612679 Free PMC article.
-
Rhusflavone Modulates Osteoclastogenesis Through RANKL-Induced AKT Signaling in Bone Marrow-Derived Macrophages.Int J Mol Sci. 2025 Mar 26;26(7):3025. doi: 10.3390/ijms26073025. Int J Mol Sci. 2025. PMID: 40243668 Free PMC article.
References
-
- Schulz A., Loreth B., Battmann A., Knoblauch B., Stahl U., Pollex U., Bohle R.M. Bone matrix production in osteosarcoma. Verh. Dtsch. Ges. Pathol. 1998;82:144–153. - PubMed
Grants and funding
LinkOut - more resources
Full Text Sources
Research Materials
Miscellaneous

