. 2024 Sep 26;13(10):1167.
doi: 10.3390/antiox13101167.

Metabolomic Profiling Reveals That Exercise Lowers Biomarkers of Cardiac Dysfunction in Rats with Type 2 Diabetes

Affiliations

Metabolomic Profiling Reveals That Exercise Lowers Biomarkers of Cardiac Dysfunction in Rats with Type 2 Diabetes

Tutu Wang et al. Antioxidants (Basel). .

Abstract

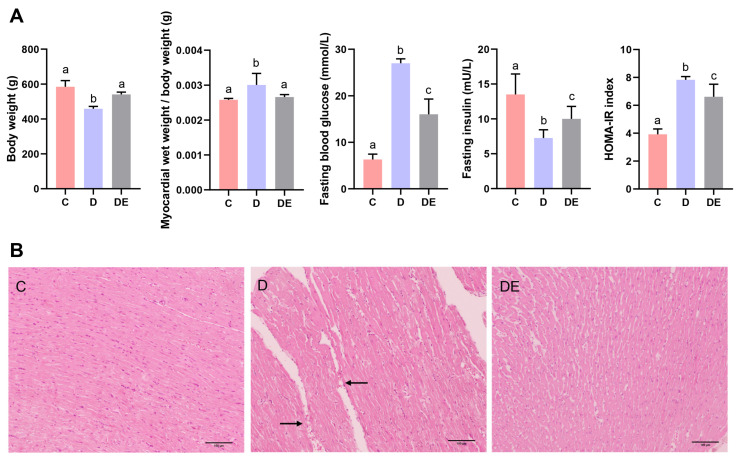
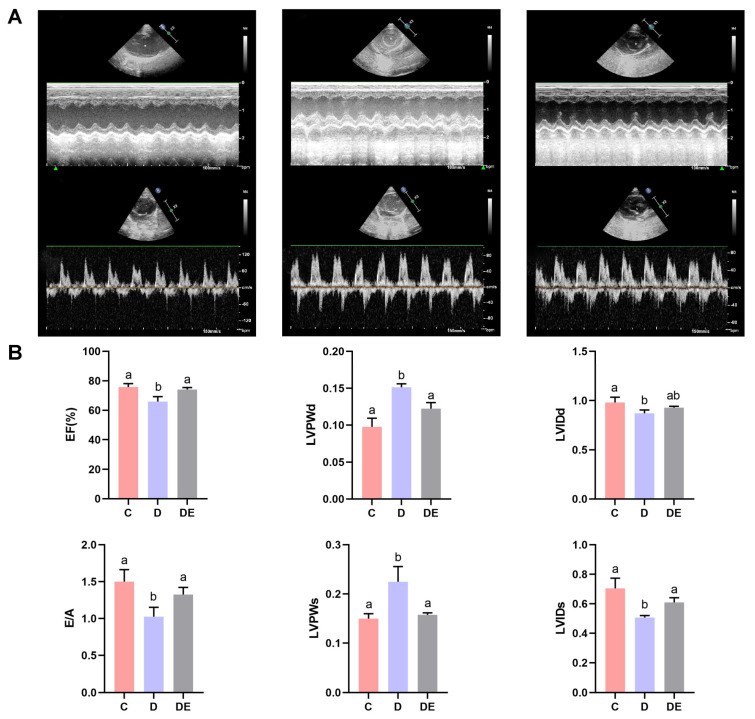
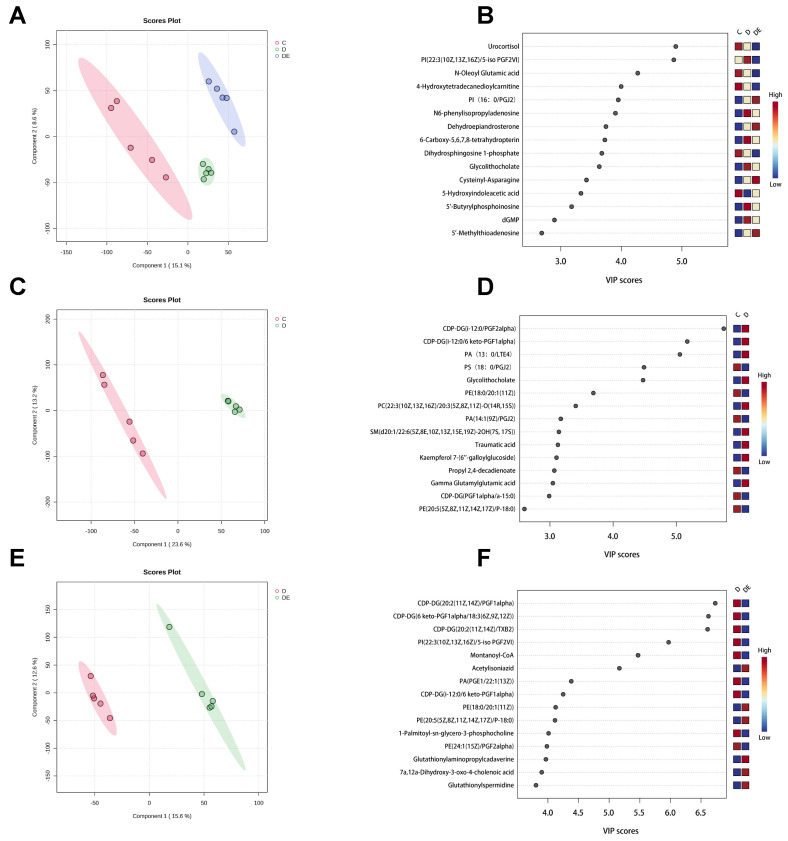
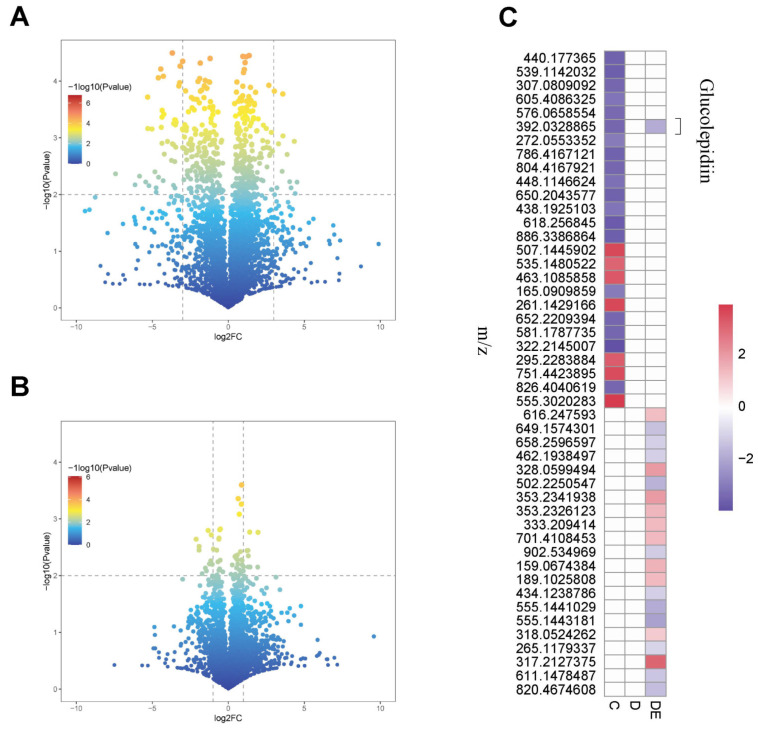
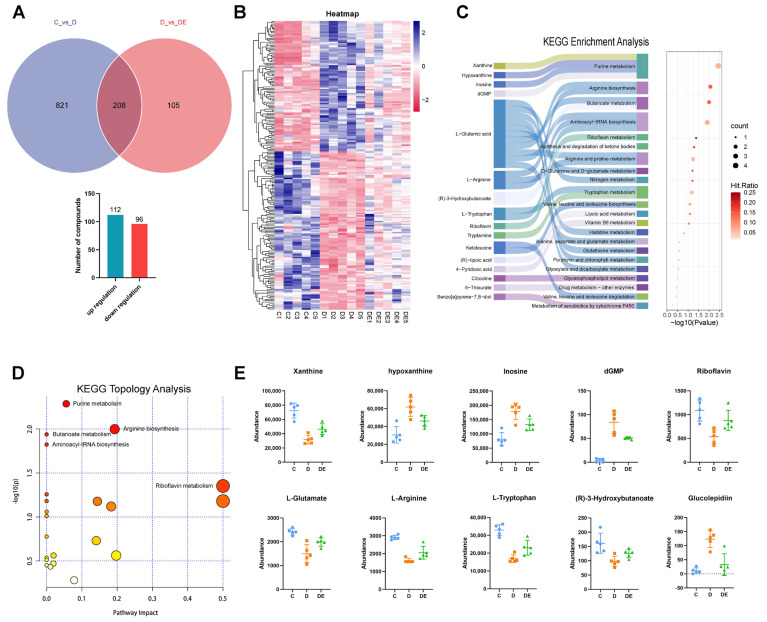
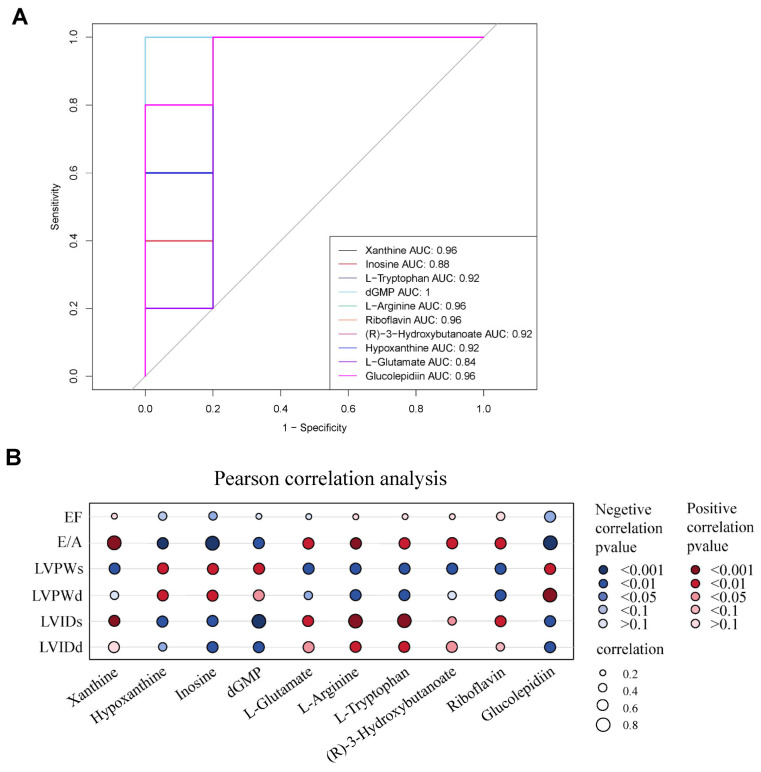
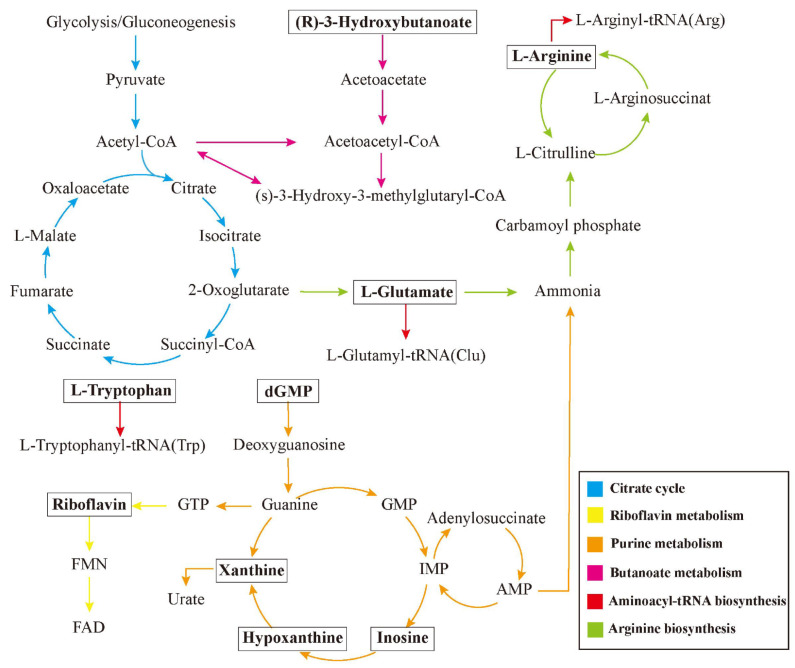
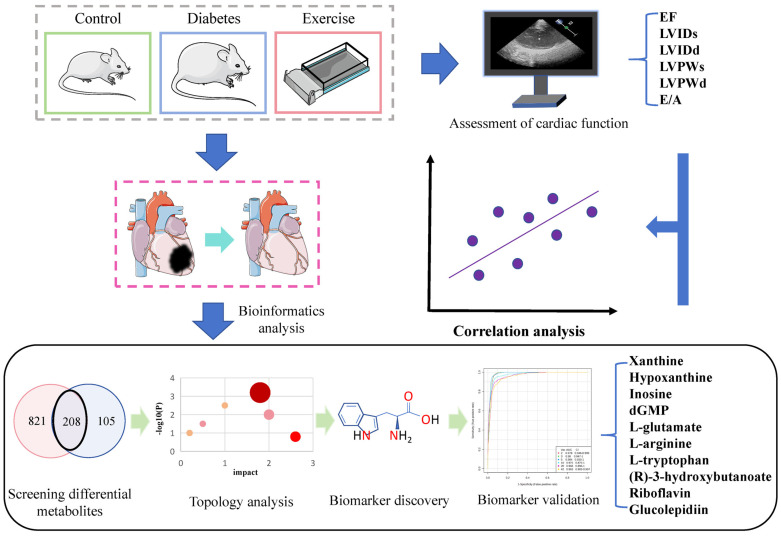
The increasing prevalence of type 2 diabetes mellitus (T2DM) leads to significant global health challenges, including cardiac structural and functional deficits, which in severe cases can progress to heart failure that can further strain healthcare resources. Aerobic exercise can ameliorate cardiac dysfunction in individuals with diabetes, although a comprehensive understanding of its underlying mechanisms remains elusive. This study utilizes untargeted metabolomics to reveal aerobic-exercise-activated metabolic biomarkers in the cardiac tissues of Sprague Dawley rats with T2DM. Metabolomics analysis revealed that diabetes altered 1029 myocardial metabolites, while aerobic exercise reversed 208 of these metabolites, of which 112 were upregulated and 96 downregulated. Pathway topology analysis suggested that these metabolites predominantly contributed to purine metabolism and arginine biosynthesis. Furthermore, receiver operating characteristic curve analysis identified 10 potential biomarkers, including xanthine, hypoxanthine, inosine, dGMP, l-glutamic acid, l-arginine, l-tryptophan, (R)-3-hydroxybutyric acid, riboflavin, and glucolepidiin. Finally, data from Pearson correlation analysis indicated that some metabolic biomarkers strongly correlated with cardiac function. Our data suggest that certain metabolic biomarkers play an important role in ameliorating diabetes-related cardiac dysfunction by aerobic exercise.

Keywords: aerobic exercise; cardiac function; metabolomics; type 2 diabetes.


Conflict of interest statement

None of the other authors reported any conflicts of interest in this study. The results of the study are presented clearly and honestly without fabrication, falsification, or inappropriate manipulation of data.

Figures

Figure 1
Figure 1
Changes in body weight, myocardial wet weight-to-body weight ratio, fasting blood glucose, fasting insulin, HOMA-IR index, and myocardial structure in T2DM rats after 8 weeks of aerobic exercise intervention. (A) Rats from group D had increased myocardial wet weight/body weight ratios compared to rats from group C (p < 0.01), whereas exercise reduced this ratio in diabetic rats (p < 0.01). Blood glucose and insulin resistance levels were higher in diabetic rats (p < 0.01), which were reduced by aerobic exercise (p < 0.05). (B) Representative histological HE staining images of myocardial longitudinal sections from different rat groups (×100), with a scale bar of 100 μm. The area indicated by the arrow shows inflammatory infiltration and vacuolar degeneration in rat cardiomyocytes. Different letters indicate significant differences between groups (p < 0.05), groups with the same letter are not significantly different (p > 0.05). HOMA-IR = homeostatic model assessment for insulin resistance; HE = hematoxylin–eosin. Numerical values are presented as means ± standard deviation. C, control group; D, diabetic group; DE, diabetic exercise group.
Figure 2
Figure 2
Effects of an 8-week aerobic exercise program on cardiac function in diabetic rats. (A) Representative M-mode echocardiographic images from rats in groups C, D, and DE. (B) Echocardiographic results indicated that diabetes diminished parameters of cardiac function such as EF, E/A, LVIDd; LVIDs (p < 0.05). Exercise increased all these parameters (p < 0.05), except for LVIDd, which remained unchanged (p > 0.05). LVPWd and LVPW values rats from group D were increased compared to those in group C (p < 0.05); exercise reversed these changes (p < 0.05). Different letters indicate significant differences between groups (p < 0.05), groups with the same letter are not significantly different (p > 0.05). EF = ejection fraction; E/A = early-to-late diastolic filling velocity ratio; LVIDd = left ventricular end-diastolic internal diameter; LVIDs = left ventricular end-systolic internal diameter; LVPWd = left ventricular posterior wall end-diastolic thickness; LVPWs = left ventricular posterior wall end-systolic thickness. Numerical values are presented as means ± standard deviation. C, control group; D, diabetic group; DE, diabetic exercise group.
Figure 3
Figure 3
Multivariate statistical analysis of myocardial metabolomics in rats from the C, D, and DE groups. (A,C,E) PLS-DA score plots. There were clear separation trends among all groups, indicating significant differences in metabolites between different groups. (B,D,F) VIP score plots. VIP values indicate that phospholipid metabolites have a significant contribution in the comparisons between different groups. PLS-DA = partial least squares discriminant analysis; VIP = the variable importance in the projection. C, control group; D, diabetic group; DE, diabetic exercise group.
Figure 4
Figure 4
Differential metabolic in rats from groups D, C and D, DE. (A,B) Volcano plots displaying differential metabolites between D, C and D, DE groups, with 61 shared differential metabolites between the C and D groups and 22 shared differential metabolites between the D and DE groups. (C) Heatmap representing the average levels of metabolites, with only one differential metabolite, glucolepidiin, that changed in all three groups. C, control group; D, diabetic group; DE, diabetic exercise group.
Figure 5
Figure 5
Effects of aerobic exercise on myocardial metabolism in diabetic rats. (A) Venn diagram showing the number of differential metabolites in groups C and D vs. D and DE. A total of 208 differential metabolites were identified, including 112 upregulated and 96 downregulated. (B) Cluster heatmap analysis of differential metabolites between groups. Metabolites in each group exhibited distinct clustering that can be separated. Blue indicates increased metabolite levels, and red signifies decreased levels. (C) KEGG enrichment analysis of differential metabolites. On the left, a Sankey diagram illustrates the connection between metabolites and metabolic pathways, and on the right, metabolites are arranged based on p-values from the enrichment analysis results. The primary enrichment is observed in metabolic pathways like purine metabolism and arginine biosynthesis. (D) Topological analysis of metabolites. A total of 23 metabolic pathways were identified, with 5 pathways having p < 0.05, including purine metabolism, arginine biosynthesis, butanoate metabolism, aminoacyl-tRNA biosynthesis, and riboflavin metabolism. (E) Selection of 10 potential metabolic markers through topological analysis and volcano plot analysis, along with their concentration changes listed. C, control group; D, diabetic group; DE, diabetic exercise group.
Figure 6
Figure 6
Validation of metabolic markers and their correlation with cardiac function. (A) ROC validation of metabolic markers, indicating that all AUC values are greater than 0.8. (B) Pearson correlation analysis was employed to ascertain the relationship between myocardial metabolic markers and heart function. Numerous metabolic markers demonstrated robust correlations with specific heart function indicators. Xanthine, inosine, and glucolepidiin exhibited strong correlations with the E/A. dGMP, arginine, and tryptophan demonstrated strong correlations with LVIDs, and glucolepidiin showed a strong correlation with LVPWd. The size of the circles in he figure denotes the strength of the correlation, where red signifies a positive correlation between metabolic markers and heart function indicators, while blue denotes a negative correlation. The intensity of color reflects the significance of the correlation. ROC = the receiver operating characteristic curve; AUC = ROC area under the curve; EF = ejection fraction; E/A = early-to-late diastolic filling velocity ratio; LVIDd = left ventricular end-diastolic internal diameter; LVIDs = left ventricular end-systolic internal diameter; LVPWd = left ventricular posterior wall end-diastolic thickness; LVPWs = left ventricular posterior wall end-systolic thickness.
Figure 7
Figure 7
Metabolic pathway map. The selected metabolic markers (shown in bold in text boxes) were integrated based on the KEGG database to visualize their interconnections. The arrows in the diagram indicate the conversion direction from one metabolite to another, involving multiple metabolic pathways such as the citrate cycle, purine metabolism, and riboflavin metabolism. Different colors in the chart are used to distinguish each metabolic pathway. Overall, these metabolites are mostly involved in different parts of amino acid metabolism, energy metabolism, and purine metabolism, and they may be interconnected through these metabolic networks. This relationship in the conversion and function of metabolites is likely closely related to the improvement of cardiac function in diabetes by exercise.
Figure 8
Figure 8
Metabolomics reveals that aerobic exercise alleviates cardiac dysfunction by altering myocardial metabolic markers in diabetic rats. Type 2 diabetic rats, successfully modeled using a high-fat, high-sugar diet, underwent echocardiographic assessment of cardiac function following 8 weeks of aerobic exercise. After the experience, myocardial tissue was extracted, and non-targeted metabolomics was used to analyze myocardial metabolites. A total of 208 differential metabolites were identified by comparing the myocardial metabolites across groups. Through topological analysis and receiver operating characteristic curve testing, 10 metabolites were selected. Finally, a Person correlation analysis revealed a relationship between the metabolites and cardiac function.

Similar articles

References

    1. Donath M.Y., Shoelson S.E. Type 2 diabetes as an inflammatory disease. Nat. Rev. Immunol. 2011;11:98–107. doi: 10.1038/nri2925. - DOI - PubMed
    1. Sampath Kumar A., Maiya A.G., Shastry B.A., Vaishali K., Ravishankar N., Hazari A., Gundmi S., Jadhav R. Exercise and insulin resistance in type 2 diabetes mellitus: A systematic review and meta-analysis. Ann. Phys. Rehabil. Med. 2019;62:98–103. doi: 10.1016/j.rehab.2018.11.001. - DOI - PubMed
    1. Karwi Q.G., Ho K.L., Pherwani S., Ketema E.B., Sun Q., Lopaschuk G.D. Concurrent diabetes and heart failure: Interplay and novel therapeutic approaches. Cardiovasc. Res. 2022;118:686–715. doi: 10.1093/cvr/cvab120. - DOI - PubMed
    1. Ho K.L., Karwi Q.G., Connolly D., Pherwani S., Ketema E.B., Ussher J.R., Lopaschuk G.D. Metabolic, structural and biochemical changes in diabetes and the development of heart failure. Diabetologia. 2022;65:411–423. doi: 10.1007/s00125-021-05637-7. - DOI - PubMed
    1. Jankauskas S.S., Kansakar U., Varzideh F., Wilson S., Mone P., Lombardi A., Gambardella J., Santulli G. Heart failure in diabetes. Metabolism. 2021;125:154910. doi: 10.1016/j.metabol.2021.154910. - DOI - PMC - PubMed

LinkOut - more resources