. 2024 Sep 30;13(10):1183.
doi: 10.3390/antiox13101183.

A Single-Cell Atlas of the Substantia Nigra Reveals Therapeutic Effects of Icaritin in a Rat Model of Parkinson's Disease

Affiliations

A Single-Cell Atlas of the Substantia Nigra Reveals Therapeutic Effects of Icaritin in a Rat Model of Parkinson's Disease

Hao Wu et al. Antioxidants (Basel). .

Abstract

Degeneration and death of dopaminergic neurons in the substantia nigra of the midbrain are the main pathological changes in Parkinson's disease (PD); however, the mechanism underlying the selective vulnerability of specific neuronal populations in PD remains unclear. Here, we used single-cell RNA sequencing to identify seven cell clusters, including oligodendrocytes, neurons, astrocytes, oligodendrocyte progenitor cells, microglia, synapse-rich cells (SRCs), and endothelial cells, in the substantia nigra of a rotenone-induced rat model of PD based on marker genes and functional definitions. We found that SRCs were a previously unidentified cell subtype, and the tight interactions between SRCs and other cell populations can be improved by icaritin, which is a flavonoid extracted from Epimedium sagittatum Maxim. and exerts anti-neuroinflammatory, antioxidant, and immune-improving effects in PD. We also demonstrated that icaritin bound with transcription factors of SRCs, and icaritin application modulated synaptic characterization of SRCs, neuroinflammation, oxidative stress, and survival of dopaminergic neurons, and improved abnormal energy metabolism, amino acid metabolism, and phospholipase D metabolism of astrocytes in the substantia nigra of rats with PD. Moreover, icaritin supplementation also promotes the recovery of the physiological homeostasis of the other cell clusters to delay the pathogenesis of PD. These data uncovered previously unknown cellular diversity in a rat model of Parkinson's disease and provide insights into the promising therapeutic potential of icaritin in PD.

Keywords: Parkinson’s disease; icaritin; neuroinflammation; oxidative stress; rotenone; single-cell RNA sequencing.


Conflict of interest statement

The authors declare no conflicts of interest.

Figures

Figure 1
Figure 1
Single-cell transcriptome atlas of the substantia nigra cells in rotenone-induced PD rats. (A). Chemical structure of icaritin. The molecular weight is 368.38 atomic mass units, and the chemical name is 3-[(5,7-dihydroxy-4-phenyl-chromenyl)oxy]-3-methyl-1-buten-4-one. (B). The rearing behavior test (5 min) and wire grip test in rats. Data are presented as the mean ± SEM. n = 9–10. (C). HPLC analysis of DA, DOPAC, and serotonin levels. Data are presented as the mean ± SEM. n = 4–5. (D). Schedule of single-cell transcriptome atlas in the substantia nigras from control, model, and icaritin groups. (E). Dot plots showing the 21 signature gene expressions across the 7 cellular clusters. The size of dots represents the proportion of cells expressing the marker, and the spectrum of color indicates the mean expression levels of the markers (log1p transformed). (F). Row-normalized single-cell gene expression heatmap of cell-type marker genes. (G). UMAP plot of all cells clustered and color coded by cell type. (H). The UMAP plot shows the changes in cell types under different treatments. (I). Relative proportion of each cell cluster across 3 groups as indicated. The values of the detailed relative proportion of each cell cluster are provided in the Source Data file. Control, control group; Model, PD model group; Selegiline, selegilin-treated group; IcaritinL: 3.27 mg/kg icaritin-treated group; IcaritinM: 6.54 mg/kg icaritin-treated group; IcaritinH: 13.08 mg/kg icaritin-treated group, ### p < 0.001 vs. Control group; * p < 0.05, ** p < 0.01, *** p < 0.001 vs. Model group.
Figure 2
Figure 2
Cells that characterize specific synapse-related genes are significantly downregulated in the substantia nigra tissue of PD rats. (A). The UMAP suggested the proportion of SRCs among three groups. (B). Dot plots showing the top 10 marker gene expressions of SRCs across the 7 cellular clusters. (C). A violin plot showing the Ryr2 and Cdh9 marker genes of SRCs across the 7 cellular clusters. (D). Representative images of RYR2 (left) and CDH9 (right) expression by immunohistochemistry staining in rat substantia nigra. The scale bar has been annotated in the diagram. Immunohistochemistry was performed with three animals per group. (E). Representative images of RYR2 (left) and CDH9 (right) expression by immunofluorescence staining in rat substantia nigra and costaining with tyrosine hydroxylase and DAPI. The scale bar has been annotated in the diagram. The experiments were repeated three times. (F). Dot plot heatmap showing GO biological process terms enriched in SRC marker genes. Hypergeometric test for overrepresentation; Benjamini–Hochberg multiple test correction. (G). Emapplot showing clusters of Gene Ontology biological process terms enriched in SRC marker genes. Hypergeometric overrepresentation test, Benjamini-Hochberg multiple testing correction. (H). The tree plot showing clusters of KEGG process terms enriched in SRC marker genes. Control, control group; Model, PD model group; IcaritinM: 6.54 mg/kg icaritin-treated group.
Figure 2
Figure 2
Cells that characterize specific synapse-related genes are significantly downregulated in the substantia nigra tissue of PD rats. (A). The UMAP suggested the proportion of SRCs among three groups. (B). Dot plots showing the top 10 marker gene expressions of SRCs across the 7 cellular clusters. (C). A violin plot showing the Ryr2 and Cdh9 marker genes of SRCs across the 7 cellular clusters. (D). Representative images of RYR2 (left) and CDH9 (right) expression by immunohistochemistry staining in rat substantia nigra. The scale bar has been annotated in the diagram. Immunohistochemistry was performed with three animals per group. (E). Representative images of RYR2 (left) and CDH9 (right) expression by immunofluorescence staining in rat substantia nigra and costaining with tyrosine hydroxylase and DAPI. The scale bar has been annotated in the diagram. The experiments were repeated three times. (F). Dot plot heatmap showing GO biological process terms enriched in SRC marker genes. Hypergeometric test for overrepresentation; Benjamini–Hochberg multiple test correction. (G). Emapplot showing clusters of Gene Ontology biological process terms enriched in SRC marker genes. Hypergeometric overrepresentation test, Benjamini-Hochberg multiple testing correction. (H). The tree plot showing clusters of KEGG process terms enriched in SRC marker genes. Control, control group; Model, PD model group; IcaritinM: 6.54 mg/kg icaritin-treated group.
Figure 3
Figure 3
SRCs interact tightly with other cell populations in the substantia nigra of PD rats. (A). Heatmap of the t values of AUC scores of expression regulation by transcription factors (TFs), as estimated using SCENIC, per cell type. (B). The top five regulons (TFs and corresponding target gene candidates) in SRCs. (C). A circle plot showed TF score relation network in SRCs. Shown are nodes (TFs) and target genes. (D,E). A circle plot showing the interactions among cell types across all samples regarding the number (left) and the weight/strength of the interactions (right). (F). Bubble plots of the main signaling pathways from SRCs to all cell groups derived from Cellchat. (G). Circos plots showing main signaling pathways from all cell groups to SRCs derived from Cellchat. (H). Circos plots of the main signaling pathways from SRCs to all cell groups derived from Cellchat.
Figure 3
Figure 3
SRCs interact tightly with other cell populations in the substantia nigra of PD rats. (A). Heatmap of the t values of AUC scores of expression regulation by transcription factors (TFs), as estimated using SCENIC, per cell type. (B). The top five regulons (TFs and corresponding target gene candidates) in SRCs. (C). A circle plot showed TF score relation network in SRCs. Shown are nodes (TFs) and target genes. (D,E). A circle plot showing the interactions among cell types across all samples regarding the number (left) and the weight/strength of the interactions (right). (F). Bubble plots of the main signaling pathways from SRCs to all cell groups derived from Cellchat. (G). Circos plots showing main signaling pathways from all cell groups to SRCs derived from Cellchat. (H). Circos plots of the main signaling pathways from SRCs to all cell groups derived from Cellchat.
Figure 4
Figure 4
Icaritin treatment improves protein localization and synaptic vesicle-mediated transport-related pathways in neurons of the substantia nigra from rats with PD. (A). UMAP plot of 3282 neurons, color-coded by their associated cluster. (B). Row-normalized single-cell gene expression heatmap of cell-type marker genes. (C). Individual cell AUC score overlay for dopamine neurons geneset activities. (D). The heatmap of GSVA of the 50 hallmark gene sets in MSigDB database among the eight neuron cell subclusters. (E). The tree plot showing clusters of KEGG process terms enriched in per cell subtype. (F). The differentially expressed genes (DEGs) among the cell population of the Icaritin samples compared to Model. The labeled genes were the top ten upregulated or downregulated DEGs ranked by the average log2FC. (G). Heatmap of the t values of AUC scores of expression regulation by transcription factors (TFs), as estimated using SCENIC, per cell subtype.
Figure 5
Figure 5
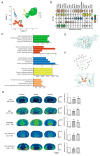
Amelioration of icaritin on the energy metabolism, phospholipid metabolism, and amino acid metabolism-related pathways in astrocytes of the substantia nigra from rats with PD. (A). Five main 2462 astrocyte cell subclusters were identified by UMAP analysis. (B). Violin plots showing the expression distribution of selected canonical cell markers in the 5 clusters. The rows represent selected marker genes, and the columns represent clusters of the same color as in (A). (C). KEGG analysis showing enriched terms in each indicated gene cluster using the differentially expressed genes (DEGs) among the cell population of the icaritin samples compared to Model. (D). In situ MALDI–MSI of ATP, ADP, aspartate, PA (18:0/18:1), and PE (16:0/18:1). Spatial resolution: 200 μm; scale bar: 5 mm; m/z: mass-to-charge ratio. The area selected by the red line is substantia nigra. n = 3. (E). Docking result of icaritin with GPI-PLD. The orange molecule is icaritin. (F). Location of icaritin’s binding site on GPI-PLD (site 1 in Table S6). Control, control group; Model, PD model group; IcaritinM: 6.54 mg/kg icaritin-treated group. # p < 0.05, ## p < 0.01 vs. Control group; * p < 0.05, ** p < 0.01 vs. Model group.
Figure 6
Figure 6
Improvement of icaritin on the gene expressions of oligodendrocytes and oligodendrocyte progenitor cells in the substantia nigra of rats with PD. (A). UMAP plot of 5936 oligodendrocytes and 860 oligodendrocyte progenitor cells, color-coded by their associated cluster. (B). Dot plots showing the 15 signature gene expressions across the 5 cellular clusters. (C). Diffusion component (D.C.) analysis of oligodendrocytes and oligodendrocyte progenitor cells colored by subcluster. (D). GO analysis showing enriched terms in each indicated gene clusters using the differentially expressed genes (DEGs) among the cell population of the icaritin group compared to the model group.

Similar articles

Cited by

References

    1. Goldberg E.L., Dixit V.D. Drivers of age-related inflammation and strategies for healthspan extension. Immunol. Rev. 2015;265:63–74. doi: 10.1111/imr.12295. - DOI - PMC - PubMed
    1. Blandini F., Armentero M.T. Animal models of Parkinson’s disease. FEBS J. 2012;279:1156–1166. doi: 10.1111/j.1742-4658.2012.08491.x. - DOI - PubMed
    1. Brück D., Wenning G.K., Stefanova N., Fellner L. Glia and alpha-synuclein in neurodegeneration: A complex interaction. Neurobiol. Dis. 2016;85:262–274. doi: 10.1016/j.nbd.2015.03.003. - DOI - PMC - PubMed
    1. Booth H.D.E., Hirst W.D., Wade-Martins R. The Role of Astrocyte Dysfunction in Parkinson’s Disease Pathogenesis. Trends Neurosci. 2017;40:358–370. doi: 10.1016/j.tins.2017.04.001. - DOI - PMC - PubMed
    1. Hook P.W., McClymont S.A., Cannon G.H., Law W.D., Morton A.J., Goff L.A., McCallion A.S. Single-Cell RNA-Seq of Mouse Dopaminergic Neurons Informs Candidate Gene Selection for Sporadic Parkinson Disease. Am. J. Hum. Genet. 2018;102:427–446. doi: 10.1016/j.ajhg.2018.02.001. - DOI - PMC - PubMed

LinkOut - more resources