. 2024 Oct 3;13(10):1201.
doi: 10.3390/antiox13101201.

Synergistic Dual Targeting of Thioredoxin and Glutathione Systems Irrespective of p53 in Glioblastoma Stem Cells

Affiliations

Synergistic Dual Targeting of Thioredoxin and Glutathione Systems Irrespective of p53 in Glioblastoma Stem Cells

Fatemeh Jamali et al. Antioxidants (Basel). .

Abstract

Glioblastoma (GBM) is an incurable primary brain cancer characterized by increased reactive oxygen species (ROS) production. The redox-sensitive tumor suppressor gene TP53, wild-type (wt) for 70% of patients, regulates redox homeostasis. Glioblastoma stem cells (GSCs) increase thioredoxin (Trx) and glutathione (GSH) antioxidant systems as survival redox-adaptive mechanisms to maintain ROS below the cytotoxic threshold. Auranofin, an FDA-approved anti-rheumatoid drug, inhibits thioredoxin reductase 1 (TrxR1). L-buthionine sulfoximine (L-BSO) and the natural product piperlongumine (PPL) inhibit the GSH system. We evaluated the cytotoxic effects of Auranofin alone and in combination with L-BSO or PPL in GBM cell lines and GSCs with a known TP53 status. The Cancer Genome Atlas/GBM analysis revealed a significant positive correlation between wtp53 and TrxR1 expression in GBM. Auranofin induced ROS-dependent cytotoxicity within a micromolar range in GSCs. Auranofin decreased TrxR1 expression, AKT (Ser-473) phosphorylation, and increased p53, p21, and PARP-1 apoptotic cleavage in wtp53-GSCs, while mutant-p53 was decreased in a mutant-p53 GSC line. Additionally, p53-knockdown in a wtp53-GSC line decreased TrxR1 expression and significantly increased sensitivity to Auranofin, suggesting the role of wtp53 as a negative redox-sensitive mechanism in response to Auranofin in GSCs. The combination of Auranofin and L-BSO synergistically increased ROS, decreased IC50s, and induced long-term cytotoxicity irrespective of p53 in GBM cell lines and GSCs. Intriguingly, Auranofin increased the expression of glutathione S-transferase pi-1 (GSTP-1), a target of PPL. Combining Auranofin with PPL synergistically decreased IC50s to a nanomolar range in GSCs, supporting the potential to repurpose Auranofin and PPL in GBM.

Keywords: Glioblastoma; Glioblastoma stem cells (GSCs); antioxidant; auranofin; drug repurposing; glutathione (GSH); oxidative stress; piperlongumine; reactive oxygen species (ROS); thioredoxin reductase.


Conflict of interest statement

The authors declare no conflicts of interest.

Figures

Figure 1
Figure 1
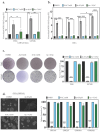
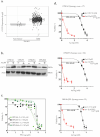
Au decreases viability of GBM cell lines and GSCs, with enhanced sensitivity in a p53-knockdown GSC line and decreased TrxR1 protein expression in GSCs. (a) TCGA analysis of Txnrd1 encoding for TrxR1 (y-axis: Txnrd1 mRNA expression, x-axis: sample types, pairwise t-tests, box plot shows the SEM). (b) Western blot analysis of TrxR1 and p53 protein expression at basal level. (c) Spearman correlation between Txnrd1 and wild-type TP53 (left) and between Txnrd1 and mutant TP53 (right) (The Cancer Genome Atlas [TCGA], Firehose Legacy). (d) Western blot analysis of TrxR1 expression in the GSC OPK49 empty vector (OP49ev), control, which harbors wild-type p53, and its counterpart p53-knockdown OPK49shRNA (OPK49sh). (e,f) Au cytotoxicity (y-axis: viability%, x-axis: log10 of Au concentrations, IC50s: µM, **** p < 0.0001) using alamarBlue assay of GSCs treated for 5 days and MTT assay of GBM cell lines treated for 72 h. (g) Western blot analysis of TrxR1 and p53 expression post-Au treatment (1 µM, 24 h). Actin was used as a loading control.
Figure 2
Figure 2
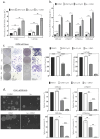
Au induces ROS-dependent long-term cytotoxicity in GSCs and GBM cell lines. (a,b) Intracellular ROS fold change of relative fluorescence units (RFU) for (a) T98G and U87MG cells treated with DMSO, 4 µM Au, 1 mM NAC alone or in combination and (b) OPK161, OPK257, OPK49ev, and OPK49sh GSCs treated with 0.5 µM Au, 1 mM NAC alone, or in combination for 24 h. (c) Representative clonogenic assay images of T98G and U87MG cells and graph for surviving fractions of cells treated with 0.5 µM Au, 1 mM NAC alone, or in combination for 10–14 days. (d) Neurosphere formation of GSCs treated with DMSO, 0.5 µM Au, 1 mM NAC alone, or in combination for 20 days. Representative images are shown with scale bar 200 µM. Spheres over 50 µM in size were counted under a microscope (20× magnification). Bar charts show the SEM (* p < 0.05 ** p < 0.01 *** p < 0.001 **** p < 0.0001).
Figure 3
Figure 3
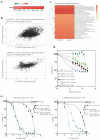
ROS-inducer compound L-BSO, a GSH inhibitor, enhances Au cytotoxicity. (a) Summarized correlation among GSH system members (GSR, GSS, SGSH, XCT, GPX4, GCLC and GSTP1) and Txnrd1 in 152 samples with available data from the TCGA GBM cohort of 577 patients. Correlation graphs are provided in Figure S3. (b) Co-expression correlation of Txnrd1 and GCLC RNA-sequencing read counts in normal and brain cancer tissue. (c) Heatmap showing the top similarly correlated pathways with both GCLC and Txnrd1. (d) Dose-response curve of GBM cell lines and GSCs treated with increasing doses of L-BSO (1–100 µM) for 72 h or 5 days. (e,f) Dose-response curve of GBM cell lines and GSCs treated with varying concentrations of Au and co-treatment with 5 µM or 10 µM L-BSO (GBM cell lines T98G and U87MG) or 1, 5, or 10 µM L-BSO (GSCs). Cell viability was assessed using MTT and alamarBlue assays for GBM cell lines and GSCs, respectively. Scores > 10 are considered synergistic, 0 to 10 are considered additive, and lower than 10 are considered antagonistic. GraphPad Prism was used to generate the graphs and determine IC50 values (** p < 0.01 *** p < 0.001 **** p < 0.0001).
Figure 3
Figure 3
ROS-inducer compound L-BSO, a GSH inhibitor, enhances Au cytotoxicity. (a) Summarized correlation among GSH system members (GSR, GSS, SGSH, XCT, GPX4, GCLC and GSTP1) and Txnrd1 in 152 samples with available data from the TCGA GBM cohort of 577 patients. Correlation graphs are provided in Figure S3. (b) Co-expression correlation of Txnrd1 and GCLC RNA-sequencing read counts in normal and brain cancer tissue. (c) Heatmap showing the top similarly correlated pathways with both GCLC and Txnrd1. (d) Dose-response curve of GBM cell lines and GSCs treated with increasing doses of L-BSO (1–100 µM) for 72 h or 5 days. (e,f) Dose-response curve of GBM cell lines and GSCs treated with varying concentrations of Au and co-treatment with 5 µM or 10 µM L-BSO (GBM cell lines T98G and U87MG) or 1, 5, or 10 µM L-BSO (GSCs). Cell viability was assessed using MTT and alamarBlue assays for GBM cell lines and GSCs, respectively. Scores > 10 are considered synergistic, 0 to 10 are considered additive, and lower than 10 are considered antagonistic. GraphPad Prism was used to generate the graphs and determine IC50 values (** p < 0.01 *** p < 0.001 **** p < 0.0001).
Figure 4
Figure 4
Combining Au with L-BSO resulted in significantly higher ROS levels and long-term cytotoxicity compared to each drug alone. (a) ROS elevation in T98G and U87MG GBM cell lines after 24 h treatment with 4 µM Au and/or 5 µM L-BSO. (b) ROS elevation in OPK161, OPK257, OPK49ev, and OPK49sh GSCs following 24 h treatment with 1 µM Au and/or 5 µM L-BSO. ROS absorbance was normalized to DMSO controls. (c) Clonogenic assays of T98G and U87MG following treatment with 0.1 µM Au and/or 1 µM L-BSO. Survival fraction was calculated after fixing and staining with crystal violet. (d) Neurosphere formation in GSCs evaluated upon treating cells with 0.1 µM Au and/or 1 µM L-BSO. After 20 days, spheres were counted under a microscope (20× magnification). Bar charts show the SEM (* p < 0.05 ** p < 0.01 *** p < 0.001 **** p < 0.0001).
Figure 5
Figure 5
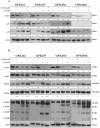
Au alone and in combination with L-BSO decreased TrxR1 and P-AKT while inducing wtp53 activation and apoptosis in GSCs. Western blot analysis showing expression of (a) TrxR1, p53, p21 and (b) phosphorylated p-AKT (Ser-473), total (T-AKT), phosphorylated ERK1/2 (p-ERK), total ERK1/2 (T-ERK), total (T-PARP-1) and cleaved (C-PARP) apoptotic bands (89 kDa) and necrotic bands (55 kDa). wtp53 OPK161, mutp53 OPK257, wtp53 OPK49ev, and wtp53-knockdown OPK49sh GSCs were treated with DMSO control (−) or 1 µM (+) Au and/or 5 µM L-BSO (+) for 24 h. Actin was used as a loading control. Band intensities were quantified and normalized to actin. Values are shown relative to DMSO control. Bar graphs of densitometry analysis are provided in Supplementary Figure S5.
Figure 6
Figure 6
Auranofin (Au) increased GSTP-1 and synergistically increased Piperlongumine (PPL) cytotoxicity to a nanomolar range in GSCs. (a) TCGA analysis of GSTP1 expression in 528 GBM patients compared to 10 normal samples (y-axis: Txnrd1 expression, x-axis: sample types, pairwise t-tests, bar charts show the SEM). (b) Western blotting analysis of GSTP1 expression in GSCs following Au treatment at 1 µM for 24. (c) Evaluation of PPL cytotoxicity (y-axis viability%, x-axis log10 of Au concentrations, IC50s: µM, **** p < 0.0005) using alamarBlue assay in GSCs treated for 5 days (d) Dose-response curves of GSCs treated with varying Au concentrations and co-treatment with 0.5 µM PPL. IC50 values were determined, and graphs were generated using GraphPad Prism (** p < 0.01 *** p < 0.001 **** p < 0.0001).

References

    1. Louis D.N., Perry A., Wesseling P., Brat D.J., Cree I.A., Figarella-Branger D., Hawkins C., Ng H.K., Pfister S.M., Reifenberger G., et al. The 2021 WHO Classification of Tumors of the Central Nervous System: A Summary. Neuro Oncol. 2021;23:1231–1251. doi: 10.1093/neuonc/noab106. - DOI - PMC - PubMed
    1. Stupp R., Mason W.P., van den Bent M.J., Weller M., Fisher B., Taphoorn M.J.B., Belanger K., Brandes A.A., Marosi C., Bogdahn U., et al. Radiotherapy plus Concomitant and Adjuvant Temozolomide for Glioblastoma. N. Engl. J. Med. 2005;352:987–996. doi: 10.1056/NEJMoa043330. - DOI - PubMed
    1. Ostrom Q.T., Price M., Neff C., Cioffi G., Waite K.A., Kruchko C., Barnholtz-Sloan J.S. CBTRUS Statistical Report: Primary Brain and Other Central Nervous System Tumors Diagnosed in the United States in 2016-2020. Neuro Oncol. 2023;25:IV1–IV99. doi: 10.1093/neuonc/noad149. - DOI - PMC - PubMed
    1. Alves A.L.V., Gomes I.N.F., Carloni A.C., Rosa M.N., da Silva L.S., Evangelista A.F., Reis R.M., Silva V.A.O. Role of Glioblastoma Stem Cells in Cancer Therapeutic Resistance: A Perspective on Antineoplastic Agents from Natural Sources and Chemical Derivatives. Stem Cell Res. Ther. 2021;12:206. doi: 10.1186/s13287-021-02231-x. - DOI - PMC - PubMed
    1. Bao S., Wu Q., McLendon R.E., Hao Y., Shi Q., Hjelmeland A.B., Dewhirst M.W., Bigner D.D., Rich J.N. Glioma Stem Cells Promote Radioresistance by Preferential Activation of the DNA Damage Response. Nature. 2006;444:756–760. doi: 10.1038/nature05236. - DOI - PubMed

LinkOut - more resources