. 2024 Oct 15;13(10):1241.
doi: 10.3390/antiox13101241.

Hydrogen Sulfide Modulates Astrocytic Toxicity in Mouse Spinal Cord Cultures: Implications for Amyotrophic Lateral Sclerosis

Affiliations

Hydrogen Sulfide Modulates Astrocytic Toxicity in Mouse Spinal Cord Cultures: Implications for Amyotrophic Lateral Sclerosis

Susanna De Stefano et al. Antioxidants (Basel). .

Abstract

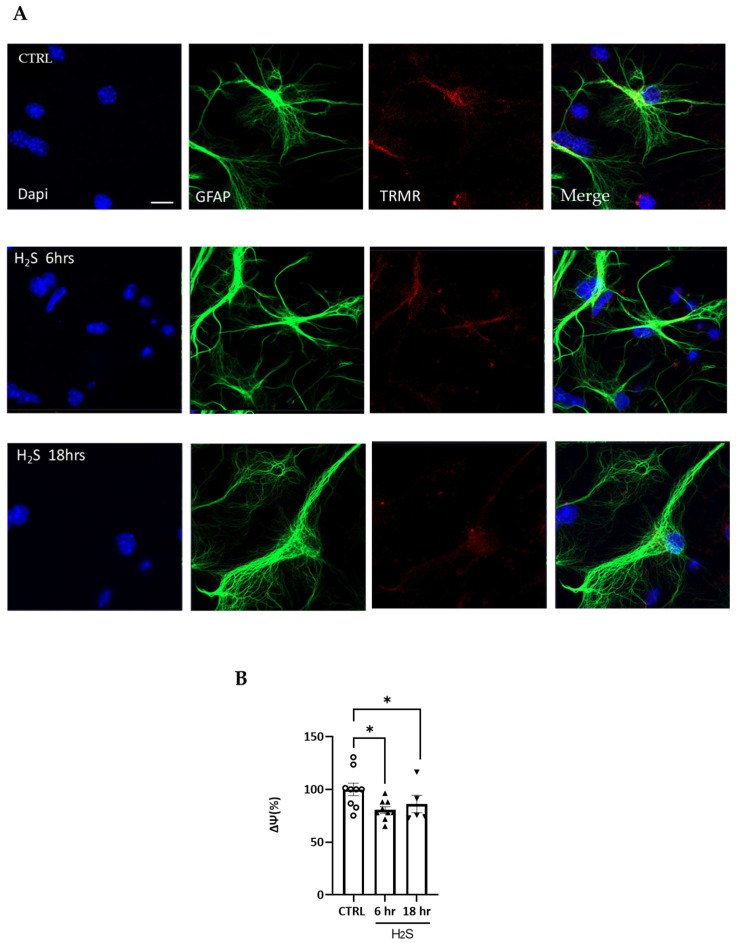
Hydrogen sulfide (H2S), a known inhibitor of the electron transport chain, is endogenously produced in the periphery as well as in the central nervous system, where is mainly generated by glial cells. It affects, as a cellular signaling molecule, many different biochemical processes. In the central nervous system, depending on its concentration, it can be protective or damaging to neurons. In the study, we have demonstrated, in a primary mouse spinal cord cultures, that it is particularly harmful to motor neurons, is produced by glial cells, and is stimulated by inflammation. However, its role on glial cells, especially astrocytes, is still under-investigated. The present study was designed to evaluate the impact of H2S on astrocytes and their phenotypic heterogeneity, together with the functionality and homeostasis of mitochondria in primary spinal cord cultures. We found that H2S modulates astrocytes' morphological changes and their phenotypic transformation, exerts toxic properties by decreasing ATP production and the mitochondrial respiration rate, disturbs mitochondrial depolarization, and alters the energetic metabolism. These results further support the hypothesis that H2S is a toxic mediator, mainly released by astrocytes, possibly acting as an autocrine factor toward astrocytes, and probably involved in the non-cell autonomous mechanisms leading to motor neuron death.

Keywords: astrocytes; hydrogen sulfide; mitochondria; motor neuron.


Conflict of interest statement

The authors declare no conflict of interest.

Figures

Figure 1
Figure 1
Astrocytes are the major non-neuronal cell population in primary spinal cord cultures. (A) Spinal cord cultures were prepared from 13.5 day-old embryos, and after 10–12 days in cultures, their composition was analyzed by high-dimensional flow cytometry using specific cellular markers (see the Section 2.2). (B) The flow cytometry analyses attested that astrocytes were the major non-neuronal cell population in the spinal cord cultures (ACSA-2+).
Figure 2
Figure 2
H2S affects astrocyte morphology and phenotype. Representative images of astrocytes (GFAP+) in (A) control (Ctrl) and (B) H2S-treated (200 µM, 18 h) cultures. (C) Cumulative data of the quantification of soma size at the indicated times. The size of the GFAP+ cell body was calculated by tracing a scale bar along the cell diameter in the control (10 µm) and treated (20 µm) cultures, where 10 random fields were captured, and 10 cells/fields were measured. (D) High-dimensional flow cytometry of A1 ACSA-2+ cell (C3+) and A2 ACSA-2+ (S100A+) markers. On the left are representative scatter plots of the flow cytometry analysis of spinal cord cultures treated with H2S; on the right are the cumulative data of the percentage of the C3+ and S110A+ cells in the control (Ctrl) and H2S-treated cultures. Data represent the mean ± SEM of three independent experiments, * p < 0.05 vs. CTRL, ** p < 0.01 vs. CTRL. In the (C) circles and triangles represent different time of treatments, control, 6, 18 h. In (D) white and red circles represent control and H2S (200 µM) 18 h.
Figure 3
Figure 3
H2S treatment upregulates Cx43 expression. The expression levels of the Cx43 protein were analyzed by Western blotting following treatment with H2S (200 µM) at 3, 6, and 18 h. (A) Representative Western blot showing Cx43 protein expression in non-treated group (CTRL) and after H2S treatment. The expression of all the bands probed with the CX43 antibody were quantified and normalized to that of GAPDH, used as an internal loading control. (B) The data are expressed in percentages as the ratio of the sum of the Cx43 bands to GAPDH compared to the CTRL cultures and represent the mean ± SEM from seven to ten independent experiments, **** p < 0.0001 vs. CTRL. (C) The mRNA expression of Cx43 was assessed in the whole culture and remained unchanged throughout the time course. The values are represented as mean ± SEM of four independent experiments. For the protein expression circles, squares and triangles represent different time of treatments, control, 3, 6, 18 h.
Figure 4
Figure 4
H2S treatment affects mitochondrial functionality. Oxygen consumption rate (OCR) was assessed through a Cell Mito Stress Test. (A) Representative mitochondrial stress test profile obtained with sequential injection (as indicated by the arrows) of oligomycin, FCCP, rotenone, and antimycin A. The x-axis represents the time points when each measurement was captured. The histograms represent the individual parameters: (B) basal respiration (C) ATP production, (D) maximal respiration, and (E) spare respiration capacity. All data were analyzed using the XFe Wave software 2.6. Data represent means ± SD of relative values vs. CTRL from seven independent experiments. ** p < 0.01; *** p < 0.001; **** p < 0.0001 statistical analysis was performed with one-way ANOVA with Tukey’s test for multiple comparisons. Circles, squares and triangles represent the different treatments, control, H2S, AraC, H2S + AraC.
Figure 5
Figure 5
H2S alters mitochondrial membrane potential. H2S at 200 μM was incubated at different times, and then the cells were loaded with TRMR (red). The cells were fixed and incubated with Dapi and GFAP (astrocyte marker in green), and confocal images were captured at 40X. In A, non-treated cells are shown compared to cells treated for 6 and 18 h. The pixels values were obtained using Image J (Fiji software 2.9.0) (NIH, Bethesda, MD, USA) in the entire field. After 6 and 18 h of H2S incubation, there was also a decreased level of TRMR (red) in the astrocytes (A), which was also quantified (B). The mean of the pixels was quantified in at least three different fields in at least four slides for the cultures (n = 3). Data are presented as percentages normalized to non-treated values as mean ± SEM. All values were compared by a one-way ANOVA test with * p < 0.05. Scale bar: 10 micron (A).
Figure 6
Figure 6
H2S promotes changes in the mRNA expression of components of lactate transport and the lactate/pyruvate metabolism. Primary spinal cord cultures were incubated with H2S (200 µM) for 18 h. (A) The mRNA expression of MCT1, MCT2, MCT4, LDHA, LDHB, and Na+/K+ ATP-ase α2 subunit was assessed in the whole culture. The tested mRNA expression remained unchanged, and we were not able to obtain a reliable quantification of MCT4. (B) Following the sorting of the ACSA1/2+ cells, the groups were compared using Student’s t test with * p < 0.05. White and black circles represent control and H2S (200 µM) 18 h.
Figure 7
Figure 7
H2S stimulates CytC release and caspase-3 cleavage. Primary spinal cord cultures were incubated with H2S (200 µM) at the indicated times. (A) CytC protein bands in total cell extracts and glyceraldehyde 3-phosphate dehydrogenase (GAPDH) were used as a loading control. (B) The histogram shows the quantification of the H2S-induced CytC release as a percentage. The values (normalized to GAPDH) are expressed as mean ± SEM from three experiments. All values were compared by a one-way ANOVA test with ** p < 0.01. (C) Caspase-3 (CASP3) protein bands (34 KDa) are shown in the upper panel, and cleaved CASP3 (19 KDa and 17 KDa) is shown in the lower panel. (D) The values (normalized to GAPDH) are expressed as mean ± SEM from three experiments. All values were compared by a one-way ANOVA test with **** p < 0.0001. White circles, black squares and triangles represent the different time of treatments, control, 3, 6, 18 h of H2S.

Similar articles

References

    1. Kimura H. Hydrogen Sulfide (H2S) and Polysulfide (H2Sn) Signaling: The First 25 Years. Biomolecules. 2021;11:896. doi: 10.3390/biom11060896. - DOI - PMC - PubMed
    1. Bełtowski J. Vascular Effects of Hydrogen Sulfide. Humana; New York, NY, USA: 2019. Synthesis, Metabolism, and Signaling Mechanisms of Hydrogen Sulfide: An Overview; pp. 1–8. - PubMed
    1. Murphy B., Bhattacharya R., Mukherjee P. Hydrogen Sulfide Signaling in Mitochondria and Disease. FASEB J. 2019;33:13098–13125. doi: 10.1096/fj.201901304R. - DOI - PMC - PubMed
    1. Shefa U., Kim D., Kim M.-S., Jeong N.Y., Jung J. Roles of Gasotransmitters in Synaptic Plasticity and Neuropsychiatric Conditions. Neural Plast. 2018;2018:1824713. doi: 10.1155/2018/1824713. - DOI - PMC - PubMed
    1. Lee M., Schwab C., Yu S., McGeer E., McGeer P.L. Astrocytes Produce the Antiinflammatory and Neuroprotective Agent Hydrogen Sulfide. Neurobiol. Aging. 2009;30:1523–1534. doi: 10.1016/j.neurobiolaging.2009.06.001. - DOI - PubMed

LinkOut - more resources