Review
. 2024 Oct 17;13(10):1254.
doi: 10.3390/antiox13101254.

Innovations in Nuclear Medicine Imaging for Reactive Oxygen Species: Applications and Radiopharmaceuticals

Affiliations
Review

Innovations in Nuclear Medicine Imaging for Reactive Oxygen Species: Applications and Radiopharmaceuticals

Joo Yeon Park et al. Antioxidants (Basel). .

Abstract

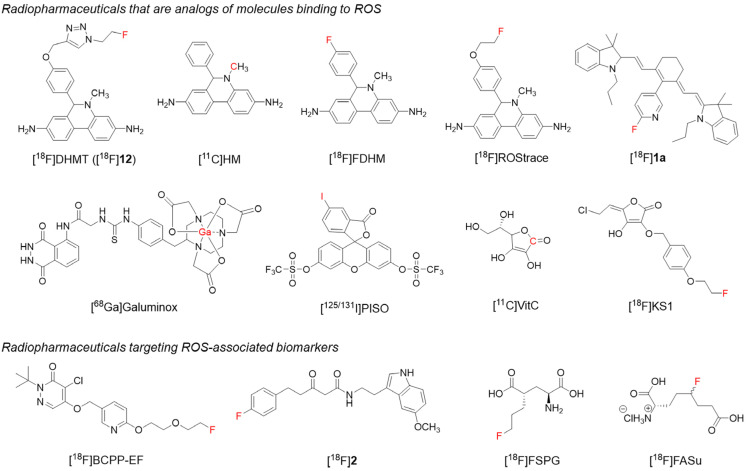
Reactive oxygen species (ROS) are generated during normal cellular energy production and play a critical role in maintaining cellular function. However, excessive ROS can damage cells and tissues, contributing to the development of diseases such as cardiovascular, inflammatory, and neurodegenerative disorders. This review explores the potential of nuclear medicine imaging techniques for detecting ROS and evaluates various radiopharmaceuticals used in these applications. Radiopharmaceuticals, which are drugs labeled with radionuclides, can bind to specific biomarkers, facilitating their identification in vivo using nuclear medicine equipment, i.e., positron emission tomography and single photon emission computed tomography, for diagnostic purposes. This review includes a comprehensive search of PubMed, covering radiopharmaceuticals such as analogs of fluorescent probes and antioxidant vitamin C, and biomarkers targeting mitochondrial complex I or cystine/glutamate transporter.

Keywords: nuclear medicine; oxidative stress; positron emission tomography; radiopharmaceutical; reactive oxygen species; single photon emission computed tomography.


Conflict of interest statement

We (B.S.M. and B.S.K.), as the corresponding authors, declare on behalf of all the authors of the submission that there is not any financial interest or personal relationship with other people or organizations that could inappropriately influence this work. This submission has been approved by all coauthors, and all authors fully endorse the contents of this report.

Figures

Figure 1
Figure 1
Chemical structures for radiopharmaceuticals targeting reactive oxygen species (ROS) and ROS-associated biomarkers. The red-highlighted elements represent the radioisotopes.
Figure 2
Figure 2
PET imaging of the heart in untreated (CTL) and DOX-treated (DOX) mice with [18F]12. Initial radioactive uptake in the heart was similar between the two groups, but after 1 h, radioactive uptake in DOX-treated mice was approximately 2-fold higher than in untreated mice. The images (left) show PET scans of the heart, with corresponding quantitative data (right) illustrating the difference in uptake over time. PET, positron emission tomography; DOX, doxorubicin. Reproduced from [39], copyright © 2014, Organic & Biomolecular Chemistry.
Figure 3
Figure 3
Quantitative evaluation of myocardial ROS activity using [18F]DHMT PET images. [18F]DHMT PET imaging represents microPET (left, top) and microPET/CT (left, bottom), with images from the control group (CTL) and DOX-treated mice (DOX) obtained at different time points (weeks 4 and 6). The bar graph (right) shows the comparative analysis of radioactive uptake between the groups (myocardial/blood SUV). PET, positron emission tomography; DOX, doxorubicin; ROS, reactive oxygen species; CT, computed tomography; SUV, standardized uptake value. * p < 0.05. Reproduced from [40], copyright © 2018, JACC: Basic to Translational Science.
Figure 4
Figure 4
[11C]HM PET imaging. [11C]HM PET static image ((A), 0–60 min), including transverse, coronal, and sagittal views, showing cylindrical regions of interest (ROIs) representing the right (◆) and left (□) striatum and cerebellum. Time-activity curves of the right and left striatum (B) and the whole brain, right cerebellum, and left cerebellum (C) are shown. PET, positron emission tomography. Reproduced from [43], copyright © 2017, Nuclear Medicine and Biology.
Figure 5
Figure 5
[18F]FDHM PET imaging of the brain. PET imaging was performed as dynamic images over 90 min, with image data integrated every 15 min. The red circles in the 75–90-min image indicate the area where SNP/saline was injected. PET, positron emission tomography; SNP, sodium nitroprusside. Reproduced from [44], copyright © 2020, Organic & Biomolecular Chemistry.
Figure 6
Figure 6
[18F]ROStrace PET imaging. Dynamic PET images were acquired for 60 min after intravenous [18F]ROStrace administration. (A) Representative image showing brain uptake from 40 to 60 min post-injection. (B) The graph compares the average %ID/cm3 values from 40 to 60 min post-injection between control and LPS-treated animals, showing a significant increase in the LPS-treated group. PET, positron emission tomography; LPS, lipopolysaccharide. %ID/cm3, percent injected dose per cubic centimeter. Reproduced from [45], copyright © 2018, ACS Chemical Neuroscience.
Figure 7
Figure 7
[18F]1a PET/CT image (left) and biodistribution results (right). [18F]1a PET image was obtained 2 h post-injection. Biodistribution data are expressed as percent injected dose per gram (% ID/g). PET, positron emission tomography; CT, computed tomography. Reproduced from [46], copyright © 2017, Chemistry.
Figure 8
Figure 8
[68Ga]Galuminox PET/CT imaging. (A) PET images were acquired as 0–60-min dynamic scans; the displayed images are the 45–60-min summation frame. C57BL/6 mice in each group were intraperitoneally administered LPS (5 μg/g, 24 h after treatment, left) or saline (right). (B) SUV in the lungs of mice administered LPS or saline (mean ± SEM, **** p < 0.0001). The group administered LPS maintained a higher uptake value. PET, positron emission tomography; CT, computed tomography; SUV, standardized uptake value; LPS, lipopolysaccharide. Reproduced from [47], copyright © 2020, Redox Biology.
Figure 9
Figure 9
[125/131I]PISO SPECT/CT imaging. (A) [131I]PISO SPECT/CT images of an endogenous O2•− model. Increased [131I]PISO uptake in the endogenous O2•− model was reduced by Tiron (0.4 μg/g). (B) SPECT/CT images of an inflammation model following the intravenous injection of [125I]PISO (upper); fluorescence image of an inflammation mouse model 1 h after intravenous injection of 100 μL of PISO (1 mg/mL, middle); an image of the inflammation mouse model (lower). SPECT, single photon emission computed tomography; CT, computed tomography. Reproduced from [48], copyright © 2018, Analytical Chemistry.
Figure 10
Figure 10
Representative PET images of [11C]DHA and [11C]VitC. (A) Oxidized form of [11C]VitC ([11C]DHA) and (B) [11C]VitC in a normal rat brain; (C) time-activity curve of the brain region of interest (ROI) data for dynamic scans. PET, positron emission tomography; DHA, dehydroascorbic acid Reproduced from [21], copyright © 2016, Chemical Communications.
Figure 11
Figure 11
Representative PET/CT images of [18F]KS1. (A) A healthy rhesus monkey. (B) A monkey with an irradiated hepatic tumor. (C) Washout profile from 30 to 180 min in healthy rhesus monkeys. PET, positron emission tomography; CT, computed tomography. Reproduced from [30], copyright © 2022, Biomedicine & Pharmacotherapy.
Figure 12
Figure 12
Detection of ROS production using DHE fluorescence and [18F]BCPP-EF PET imaging in QA-treated rat brain (A) Fluorescence accumulation in the quinolinic acid (QA)-injected striatum was observed 60 min after the intravenous injection of dihydroethidium (DHE). Regions of interest (ROIs) were identified as follows: prefrontal cortex (a), frontal cortex (b), parietal cortex (c), hippocampus (d), thalamus (e), and cerebellum (f). (B) [18F]BCPP-EF PET images were taken and summed 45–60 min post-injection. (C) Semiquantitative analysis of the fluorescent images (left) and radioactivity concentration measured as standardized uptake value (SUV, right) in QA and saline-treated rat brains. Data are presented as mean ± standard deviation. * p < 0.05, ** p < 0.01. PET, positron emission tomography. Reproduced from [49], copyright © 2021, EJNMMI Research.
Figure 13
Figure 13
[18F]2 PET imaging and time-activity curves of wild-type and 5× FAD mice. (A) [18F]2 PET images of wild-type and 5× FAD mice, summed 20–60 min post-injection. (B) Time-activity curves represent the whole brain uptake of [18F]2 in wild-type and 5× FAD mice. Data are presented as the mean percentage of the injected dose per cubic centimeter (% ID/cm3). PET, positron emission tomography. Reproduced from [50], copyright © 2021, ACS Chemical Neuroscience.
Figure 14
Figure 14
[18F]FSPG PET/CT imaging of A2780 ovarian cancer tumors in mice. (A) [18F]FSPG PET/CT images with tumors indicated by white arrows in three groups: untreated (D0), DOX-24 h (D1), or 6-day treatment (D6). (B) Quantified [18F]FSPG retention in the tumors of the three groups of mice. ** p < 0.01. PET, positron emission tomography; CT, computed tomography; DOX, doxorubicin. Reproduced from [51], copyright © 2019, Cancer Research.
Figure 15
Figure 15
[18F]FASu PET imaging in mice bearing SKOV-3 and EL4 xenograft tumors. (A) The image shows the maximum-intensity projection of SKOV-3 tumor-bearing nude mice. (B) PET/CT image summed over 110–120 min after injection in Rag2 M mice bearing EL4 xenograft tumor. The tumor is indicated by a white arrow. PET/CT, positron emission tomography/computed tomography; Pa, pancreas; Sp, Spleen; Ki, Kidney; Bl, Bladder. Reproduced from [52], copyright © 2014, Journal of Nuclear Medicine.

Similar articles

Cited by

References

    1. Mittler R. ROS are good. Trends Plant Sci. 2017;22:11–19. doi: 10.1016/j.tplants.2016.08.002. - DOI - PubMed
    1. Ramzan R., Dolga A.M., Michels S., Weber P., Culmsee C., Rastan A.J., Vogt S. Cytochrome c oxidase inhibition by ATP decreases mitochondrial ROS production. Cells. 2022;11:992. doi: 10.3390/cells11060992. - DOI - PMC - PubMed
    1. Mailloux R.J. An update on methods and approaches for interrogating mitochondrial reactive oxygen species production. Redox Biol. 2021;45:102044. doi: 10.1016/j.redox.2021.102044. - DOI - PMC - PubMed
    1. Liu M., Sun X., Chen B., Dai R., Xi Z., Xu H. Insights into manganese superoxide dismutase and human diseases. Int. J. Mol. Sci. 2022;23:15893. doi: 10.3390/ijms232415893. - DOI - PMC - PubMed
    1. Wang Y., Branicky R., Noë A., Hekimi S. Superoxide dismutases: Dual roles in controlling ROS damage and regulating ROS signaling. J. Cell Biol. 2018;217:1915–1928. doi: 10.1083/jcb.201708007. - DOI - PMC - PubMed

LinkOut - more resources