. 2024 Oct 17;16(20):3520.
doi: 10.3390/cancers16203520.

Functional Assessments of Gynecologic Cancer Models Highlight Differences Between Single-Node Inhibitors of the PI3K/AKT/mTOR Pathway and a Pan-PI3K/mTOR Inhibitor, Gedatolisib

Affiliations

Functional Assessments of Gynecologic Cancer Models Highlight Differences Between Single-Node Inhibitors of the PI3K/AKT/mTOR Pathway and a Pan-PI3K/mTOR Inhibitor, Gedatolisib

Aaron Broege et al. Cancers (Basel). .

Abstract

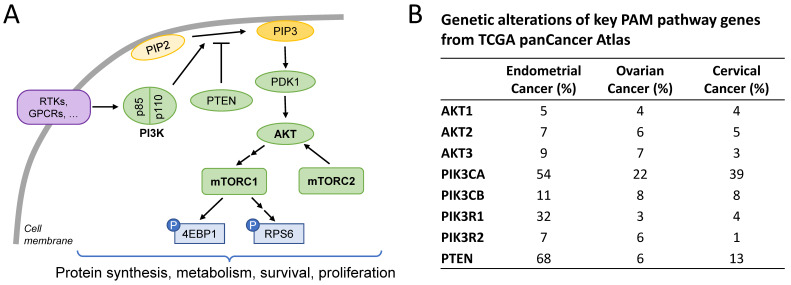
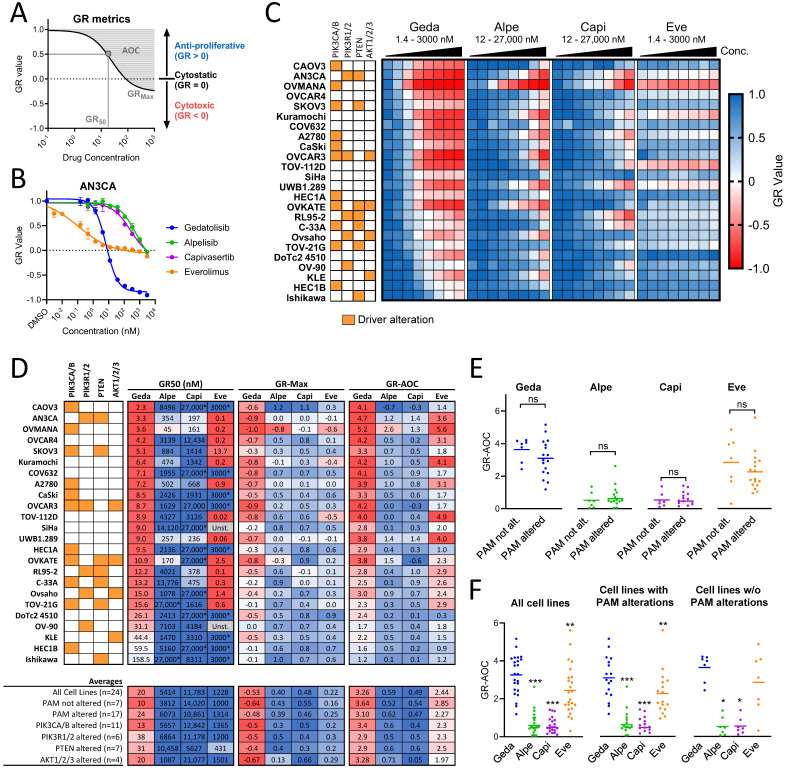
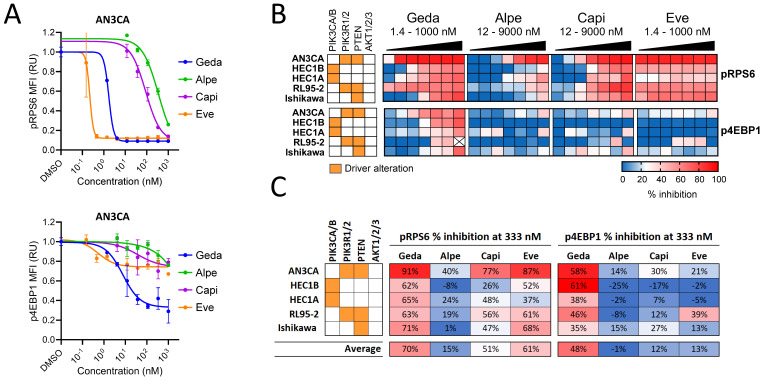
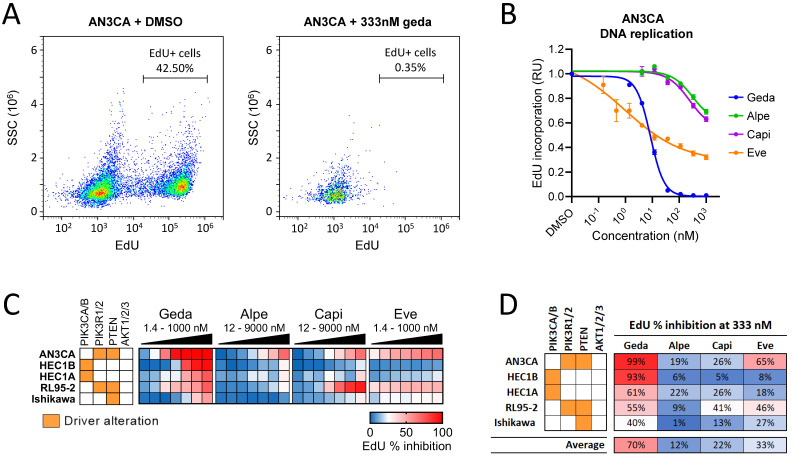
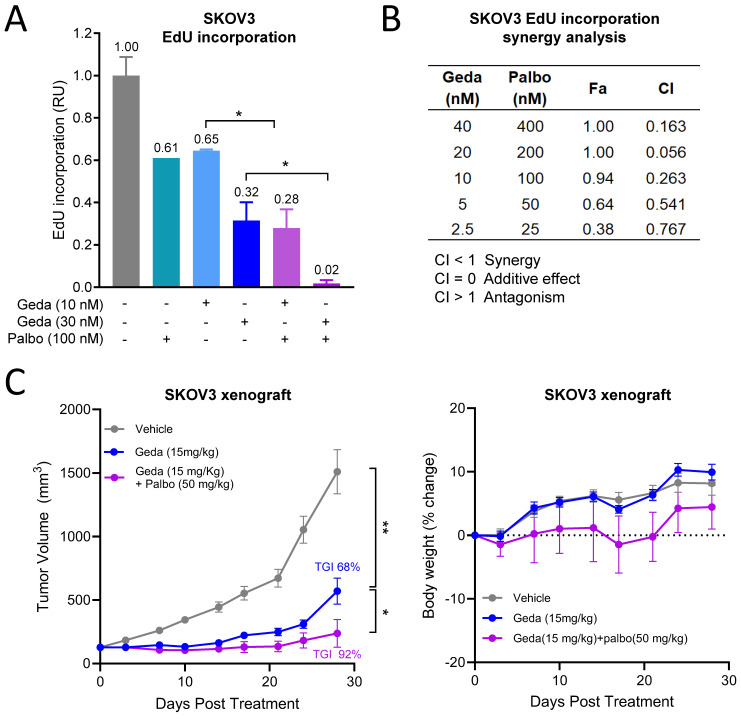
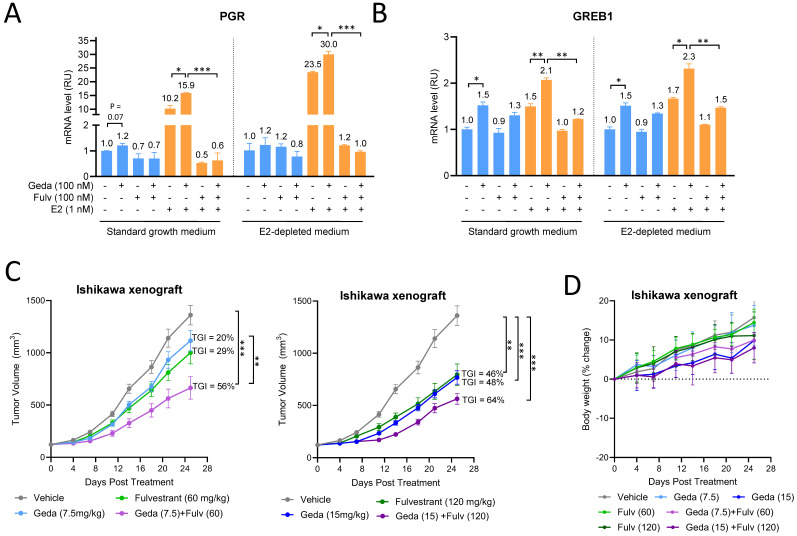
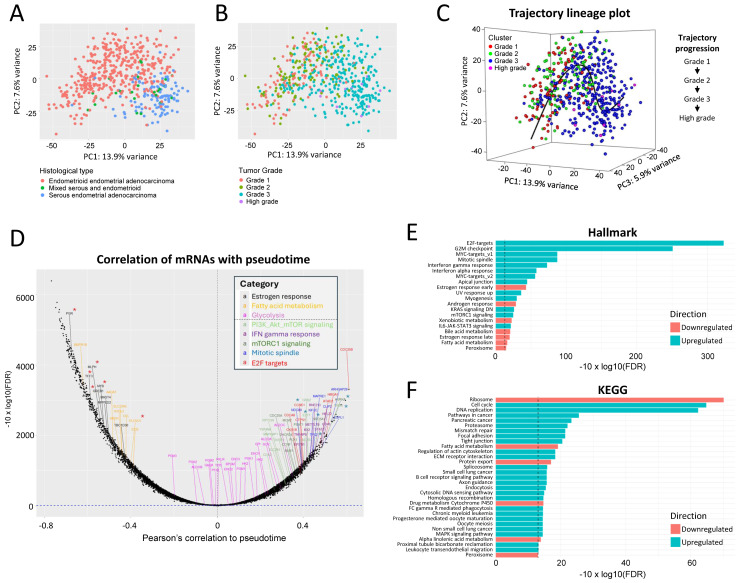
Background/Objectives: The PI3K/AKT/mTOR (PAM) pathway is frequently activated in gynecological cancers. Many PAM inhibitors selectively target single PAM pathway nodes, which can lead to reduced efficacy and increased drug resistance. To address these limitations, multiple PAM pathway nodes may need to be inhibited. Gedatolisib, a well-tolerated panPI3K/mTOR inhibitor targeting all Class I PI3K isoforms, mTORC1 and mTORC2, could represent an effective treatment option for patients with gynecologic cancers. Methods: Gedatolisib and other PAM inhibitors (e.g., alpelisib, capivasertib, and everolimus) were tested in endometrial, ovarian, and cervical cancer cell lines by using cell viability, cell proliferation, and flow cytometry assays. Xenograft studies evaluated gedatolisib in combination with a CDK4/6 inhibitor (palbociclib) or an anti-estrogen (fulvestrant). A pseudo-temporal transcriptomic trajectory of endometrial cancer clinical progression was computationally modeled employing data from 554 patients to correlate non-clinical studies with a potential patient group. Results: Gedatolisib induced a substantial decrease in PAM pathway activity in association with the inhibition of cell cycle progression and the decreased cell viability in vitro. Compared to single-node PAM inhibitors, gedatolisib exhibited greater growth-inhibitory effects in almost all cell lines, regardless of the PAM pathway mutations. Gedatolisib combined with either fulvestrant or palbociclib inhibited tumor growth in endometrial and ovarian cancer xenograft models. Conclusions: Gedatolisib in combination with other therapies has shown an acceptable safety profile and promising preliminary efficacy in clinical studies with various solid tumor types. The non-clinical data presented here support the development of gedatolisib combined with CDK4/6 inhibitors and/or hormonal therapy for gynecologic cancer treatment.

Keywords: PI3K/AKT/mTOR pathway; endometrial cancer; gedatolisib; ovarian cancer.


Conflict of interest statement

S.R., A.B., A.S., I.M., J.M. and L.L. are all employed by and/or have ownership interest in Celcuity, Inc. A.S.M. performed his work as a temporary intern at Celcuity, Inc.

Figures

Figure 1
Figure 1
The PAM pathway is frequently dysregulated in gynecologic cancers. (A) Simplified scheme showing main pathway nodes (bold). (B) cBioPortal analysis of the TCGA panCancer Atlas showing the percentage of genetic alterations of key PAM pathway genes in endometrial cancer (509 samples analyzed), ovarian cancer (398 samples analyzed), and cervical carcinoma (278 samples analyzed).
Figure 2
Figure 2
Analysis of PAM inhibitors response in gynecologic cancer cell lines using growth rate metrics. (A) GR metrics can be used to assess drugs’ anti-proliferative effects (GR value = 0–1), cytotoxic effects (GR < 0), potency (GR50), and efficacy (GRMax). Efficacy and potency can be also captured at the same time by calculating the area over the curve (GRAOC). Lower GR50 indicates higher potency; lower GRMax indicates higher efficacy; and higher GRAOC indicates higher potency and efficacy. (B) AN3CA GR values calculated by RTGlo MT assay before and after a 72 h treatment with PAM inhibitors are shown as an example. Data represent mean ± SD (n = 2 biologically independent samples). (C) Heatmap showing GR values in 24 gynecologic cancer cell lines treated with increasing concentrations of PAM inhibitors for 72 h. Concentrations shown in the heatmap = 1.4, 4.1, 12, 37, 111, 333, 1000, 3000, 9000, and 27,000 nM. See Supplementary Table S2 for data. (D) GR50, GRMax, and GRAOC values for gedatolisib and single-node PAM inhibitors in gynecologic cancer cell lines. Average values in subpopulations with or without altered PAM pathway genes are shown. * = max concentration tested, GR50 not reached; Unst. = unstable due to poor curve fitting that prevented reliable GR50 calculation. (E,F) GRAOC analysis comparing potency and efficacy of gedatolisib and single-node PAM inhibitors in cell lines with or without driver genetic alterations in key PAM pathway genes (PIK3CA/B, PIK3R1/2, PTEN, and AKT1/2/3); ns = not significant, * = p < 0.05, ** = p < 0.01, and *** = p < 0.001 by Mann–Whitney test (top) or Wilcoxon matched-pairs signed-rank test (bottom). Significance in panel (E) is relative to cell lines without PAM alterations; significance in panel (F) is relative to cell lines treated with gedatolisib.
Figure 3
Figure 3
Analysis of PAM pathway activity in response to PAM inhibitors in EC cell lines. (A) PAM pathway activity in response to a 48 h treatment with PAM inhibitors was assessed by flow cytometry analysis of pRPS6(S235/S236) and p4EBP1(T36/T45) levels. The median fluorescence intensity (MFI) was normalized to DMSO-treated cells (set as 1) and used to plot PAM inhibitors DRCs as shown here for AN3CA as an example. Concentrations shown in the heatmap = 1.4, 4.1, 12, 37, 111, 333, 1000, 3000, and 9000 nM. Data represent mean ± SD (n = 2 biologically independent samples). (B) Heatmaps showing pRPS6 and p4EBP1 levels in five EC cell lines treated with increasing concentrations of PAM inhibitors. The % inhibition is relative to DMSO-treated cells. See Supplementary Table S4 for data. (C) % inhibition of pRPS6 and p4EBP1 in response to 333 nM PAM inhibitors shows that gedatolisib is, on average, more efficacious than single-node PAM inhibitors.
Figure 4
Figure 4
Analysis of DNA replication in response to PAM inhibitors in EC cell lines. (A) Example of EdU incorporation analysis by flow cytometry in AN3CA treated with 333 nM gedatolisib or DMSO (vehicle control) for 48 h. (B) The % of EdU+ cells was normalized to DMSO-treated cells (set as 1) and used to plot PAM inhibitors DRCs as shown here for AN3CA as an example. Data represent mean ± SD (n = 2 biologically independent samples). (C) Heatmap showing inhibition of EdU incorporation in a panel of five EC cell lines response treated with increasing concentrations of PAM inhibitors for 48 h. Concentrations shown in the heatmap = 1.4, 4.1, 12, 37, 111, 333, 1000, 3000, and 9000 nM. See Supplementary Table S5 for data. (D) % inhibition of EdU incorporation in response to 333 nM PAM inhibitors shows that gedatolisib is, on average, more efficacious than single-node PAM inhibitors.
Figure 5
Figure 5
Combination of gedatolisib and palbociclib in the SKOV3 ovarian cancer model. (A) Flow cytometry analysis showing that the combination of gedatolisib and palbociclib inhibits EdU incorporation significantly more than the single drugs in SKOV3 cells. Data represent mean ± SD (n = 2 biologically independent samples). * p < 0.01 by unpaired two-sided t-test. (B) Chou–Talalay analysis showing that gedatolisib and palbociclib inhibit EdU incorporation synergistically. CI = combination index (values < 1 indicate synergy); Fa = fraction affected (0 indicates no inhibition and 1 indicates 100% inhibition). (C) SKOV3 cells were inoculated subcutaneously in the flank of BALB/c nude mice, and animals were treated with vehicle, gedatolisib (i.v. Q4D), or palbociclib (p.o. QD). Tumor growth curved and tumor growth inhibition (TGI) at the indicate time point is shown on the left. Mice body weight change during treatment is shown on the right. Data represent mean tumor volume ± SEM (n = 9–10 mice/arm). Statistical significance was calculated by one-way ANOVA; * p < 0.05, ** p < 0.01.
Figure 6
Figure 6
Combination of gedatolisib and fulvestrant in endometrial cancer models. (A,B) qPCR analysis showing that gedatolisib increased the transcription of two ERα-target genes, PGR (A) and GREB1 (B), under different growth media conditions. * p < 0.05, ** p < 0.01, and *** p < 0.001 by unpaired two-sided t-test. (C) Ishikawa cells were inoculated subcutaneously in the flank of BALB/c nude mice, and animals (n = 10/arm) were treated with vehicle, gedatolisib (i.p. Q4D), fulvestrant (s.c. Q4D), or gedatolisib + fulvestrant at the indicated doses. Tumor growth inhibition (TGI) was calculated from tumor volumes at day 25 from beginning of the treatment. Data represent mean tumor volume ± SEM (n = 10 mice/arm). Statistical significance was calculated by one-way ANOVA; ** p < 0.01, *** p < 0.001. (D) Assessment of mice body weights during treatment.
Figure 7
Figure 7
Trajectory of endometrial cancer progression. (A,B) Plots of EC tumor transcriptomes obtained from TCGA (N = 554 patients × 19,341 filtered transcripts) following dimensionality reduction by principal components analysis (PCA), colored either by tumor histological type (A) or by tumor grade (B). (C) Unbiased trajectory analysis of EC disease progression based on clinical tumor transcriptomic states. The inferred lineage of samples categorized by tumor grade is shown in the box below. (D) Plot of correlation between mRNAs and pseudotime inferred along the EC disease progression trajectory. Selected transcripts related to different hallmark pathway gene sets are shown. The horizontal dotted line indicates a cutoff value of FDR = 0.05. The transcripts marked with red and blue asterisks were chosen for further analysis (shown in Figure S6). (E,F) Gene set enrichment analysis of transcripts ranked for their correlation to pseudotime. The vertical dotted line indicates a cutoff value of FDR = 0.05.

Similar articles

Cited by

References

    1. Avila M., Grinsfelder M.O., Pham M., Westin S.N. Targeting the PI3K Pathway in Gynecologic Malignancies. Curr. Oncol. Rep. 2022;24:1669–1676. doi: 10.1007/s11912-022-01326-9. - DOI - PMC - PubMed
    1. Brasseur K., Gevry N., Asselin E. Chemoresistance and targeted therapies in ovarian and endometrial cancers. Oncotarget. 2017;8:4008–4042. doi: 10.18632/oncotarget.14021. - DOI - PMC - PubMed
    1. Bregar A.J., Growdon W.B. Emerging strategies for targeting PI3K in gynecologic cancer. Gynecol. Oncol. 2016;140:333–344. doi: 10.1016/j.ygyno.2015.09.083. - DOI - PubMed
    1. Wang Q., Peng H., Qi X., Wu M., Zhao X. Targeted therapies in gynecological cancers: A comprehensive review of clinical evidence. Signal Transduct. Target. Ther. 2020;5:137. doi: 10.1038/s41392-020-0199-6. - DOI - PMC - PubMed
    1. Glaviano A., Foo A.S.C., Lam H.Y., Yap K.C.H., Jacot W., Jones R.H., Eng H., Nair M.G., Makvandi P., Geoerger B., et al. PI3K/AKT/mTOR signaling transduction pathway and targeted therapies in cancer. Mol. Cancer. 2023;22:138. doi: 10.1186/s12943-023-01827-6. - DOI - PMC - PubMed

LinkOut - more resources