. 2024 Oct 18;16(20):3524.
doi: 10.3390/cancers16203524.

The Diversity of Methylation Patterns in Serous Borderline Ovarian Tumors and Serous Ovarian Carcinomas

Affiliations

The Diversity of Methylation Patterns in Serous Borderline Ovarian Tumors and Serous Ovarian Carcinomas

Laura A Szafron et al. Cancers (Basel). .

Abstract

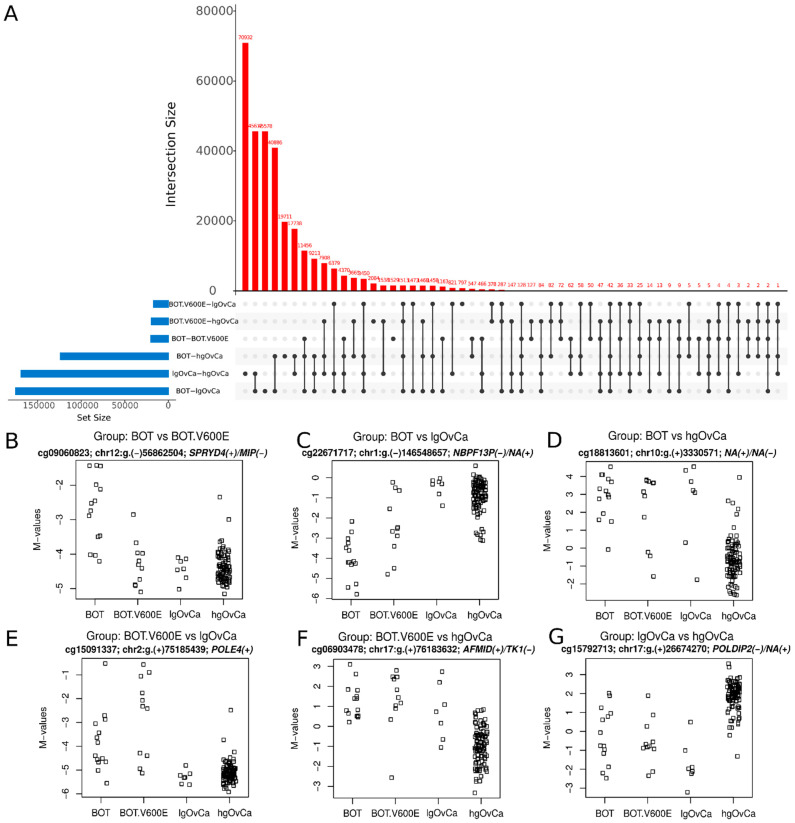
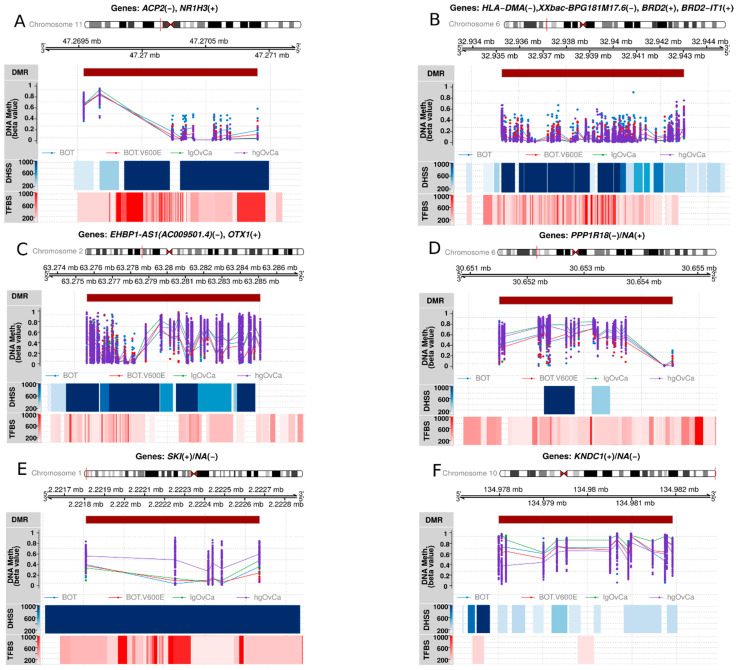
Background: Changes in DNA methylation patterns are a pivotal mechanism of carcinogenesis. In some tumors, aberrant methylation precedes genetic changes, while gene expression may be more frequently modified due to methylation alterations than by mutations. Methods: Herein, 128 serous ovarian tumors were analyzed, including borderline ovarian tumors (BOTS) with (BOT.V600E) and without (BOT) the BRAF V600E mutation, low-grade (lg), and high-grade (hg) ovarian cancers (OvCa). The methylome of the samples was profiled with Infinium MethylationEPIC microarrays. Results: The biggest number of differentially methylated (DM) CpGs and regions (DMRs) was found between lgOvCa and hgOvCa. By contrast, the BOT.V600E tumors had the lowest number of DM CpGs and DMRs compared to all other groups and, in relation to BOT, their genome was strongly downmethylated. Remarkably, the ten most significant DMRs, discriminating BOT from lgOvCa, encompassed the MHC region on chromosome 6. We also identified hundreds of DMRs, being of potential use as predictive biomarkers in BOTS and hgOvCa. DMRs with the best discriminative capabilities overlapped the following genes: BAIAP3, IL34, WNT10A, NEU1, SLC44A4, and HMOX1, TCN2, PES1, RP1-56J10.8, ABR, NCAM1, RP11-629G13.1, AC006372.4, NPTXR in BOTS and hgOvCa, respectively. Conclusions: The global genome-wide hypomethylation positively correlates with the increasing aggressiveness of ovarian tumors. We also assume that the immune system may play a pivotal role in the transition from BOTS to lgOvCa. Given that the BOT.V600E tumors had the lowest number of DM CpGs and DMRs compared to all other groups, when methylome is considered, such tumors might be placed in-between BOT and OvCa.

Keywords: DNA methylation; biomarkers; methylation microarrays; serous borderline ovarian tumor; serous ovarian carcinoma.


Conflict of interest statement

The authors declare no conflicts of interest. The sponsors had no role in the design, execution, interpretation, or writing of the study.

Figures

Figure 1
Figure 1
Violin plots of methylation changes (average beta values) in the promoter and first-exon regions of the TP53, MDM2, and CDKN1A genes (the remaining significant results are presented in Supplementary Figure S3). The values range from 0 to 1 (where 0 means no methylation and 1 denotes 100% methylation of CpGs detected in the region). Each analysis is supplemented with the results of two non-parametric statistical tests: the Kruskal–Wallis test (to determine overall methylation differences between the groups) and the Wilcoxon rank sum test to identify differences between particular groups; NS—non-significant result. Low p-values are displayed in exponential notation (e–n), in which e (exponent) multiplies the preceding number by 10 to the minus nth power.
Figure 2
Figure 2
Differentially methylated CpGs. (A): the upset plot demonstrating the number of differentially methylated CpGs in each inter-tumor-group comparison (blue bars) and the number of such CpGs (red bars) for the specific intersection of tumor groups (all sets included in the given intersection are indicated with black dots, that are connected with a line if the intersection contains more than one set). (BG): the distribution of M-values for the most differentiating CpGs for each inter-tumor-group comparison, followed by genomic locations and gene names with strand identificators shown in brackets. M-value is the log2 of the ratio between signal intensities for probes specific to methylated (numerator) and unmethylated (denominator) cytosines in the given CpG site. The higher the M-value, the higher the methylation level.
Figure 3
Figure 3
Context plots depicting the most significant DMR for each inter-tumor-group comparison. Each plot title contains encompassed gene name(s) with the DNA strand identifier (+/−), on which the coding sequence of each gene is located. Below, a chromosome ideogram, graphical representation of the genomic range, and DMR location within the genome are shown. These are followed by a line + dot plot demonstrating the distribution of beta values for each CpG and sample (dot) along with mean values for each CpG (line). The visualization of Dnase I hypersensitive sites (DHSS) and transcription factor binding sites (TFBS) is also provided for the assessment of transcriptional activity in each DMR. (A): BOT vs. BOT.V600E (chr11:g.both 47269539–47270908); (B): BOT vs. lgOvCa (chr6:g.both 32935236–32943025); (C): BOT vs. hgOvCa (chr2:g.both 63275602–63285097); (D): BOT.V600E vs. lgOvCa (chr6:g.both 30651511–30654559); (E): BOT.V600E vs. hgOvCa (chr1:g. 2221807–2222674); (F): lgOvCa vs. hgOvCa (chr10:g.both 134977981–134981930).
Figure 4
Figure 4
Nominated regression analyses for selected DMRs in hgOvCa. (AF): Cox regression analysis (OS) in the subgroup of tumors with TP53 accumulation for the HMOX1(+)/NA(−) genes. (A,B): AUC plot for uni- and multivariable models obtained before (A) and after (B) a bootstrap-based cross-validation of the original data set. A red dashed line in B indicates the same time point which was used to draw the time-dependent ROC curve (C). An optimal cutoff point for this ROC curve, was calculated based on the multivariable model using the Youden index. Discrimination sensitivity and specificity values for this cutoff point are also provided. (D): Kaplan-Meier survival curves obtained for the patients divided into two categories (risk higher (high) or lower (low) than for the ROC curve (C)-estimated cutoff point) based on the risk of death, calculated using the multivariable model. The Kaplan-Meier curves are supplemented with the result of the log-rank test, as well. Box (E) and bar (F) plots depicting mean methylation beta values within the DMR in patients with the high or low risk of death. (GI): logistic regression analysis (CR) for a DMR in unknown gene(s), in the subgroup of patients treated with the TP regimen. (G): ROC curves for uni- and multivariable logistic regression models. Box (H) and bar (I) plots depicting mean methylation beta values within the DMR in patients with (1) and without (0) CR. RT: residual tumor; TP: taxane/platinum chemotherapy; CR: complete remission. Low p-values are displayed in exponential notation (e−n), in which e (exponent) multiplies the preceding number by 10 to the minus nth power.
Figure 5
Figure 5
A nominated logistic regression analysis for a DMR in the BAIAP3(+)/NA(−) gene in the whole group of BOTS patients (Full table). (A): ROC curves for uni- and multivariable logistic regression models; Box (B) and bar (C) plots depicting mean methylation beta values within the DMR in tumors with (Yes) and without (No) microinvasion/non-invasive implants.

References

    1. Heery R., Schaefer M.H. DNA Methylation Variation along the Cancer Epigenome and the Identification of Novel Epigenetic Driver Events. Nucleic Acids Res. 2021;49:12692–12705. doi: 10.1093/nar/gkab1167. - DOI - PMC - PubMed
    1. Hanson H.E., Liebl A.L. The Mutagenic Consequences of DNA Methylation within and across Generations. Epigenomes. 2022;6:33. doi: 10.3390/epigenomes6040033. - DOI - PMC - PubMed
    1. Bourdel N., Huchon C., Abdel Wahab C., Azaïs H., Bendifallah S., Bolze P.-A., Brun J.-L., Canlorbe G., Chauvet P., Chereau E., et al. Borderline Ovarian Tumors: French Guidelines from the CNGOF. Part 2. Surgical Management, Follow-up, Hormone Replacement Therapy, Fertility Management and Preservation. J. Gynecol. Obstet. Hum. Reprod. 2021;50:101966. doi: 10.1016/j.jogoh.2020.101966. - DOI - PubMed
    1. Timor-Tritsch I.E., Foley C.E., Brandon C., Yoon E., Ciaffarrano J., Monteagudo A., Mittal K., Boyd L. New Sonographic Marker of Borderline Ovarian Tumor: Microcystic Pattern of Papillae and Solid Components. Ultrasound Obstet. Gynecol. Off. J. Int. Soc. Ultrasound Obstet. Gynecol. 2019;54:395–402. doi: 10.1002/uog.20283. - DOI - PubMed
    1. Niu L., Tian H., Xu Y., Cao J., Zhang X., Zhang J., Hou J., Lv W., Wang J., Xin L., et al. Recurrence Characteristics and Clinicopathological Results of Borderline Ovarian Tumors. BMC Womens Health. 2021;21:134. doi: 10.1186/s12905-021-01263-y. - DOI - PMC - PubMed