. 2024 Oct 15;25(20):11056.
doi: 10.3390/ijms252011056.

Contrast Relative Humidity Response of Diverse Cowpea (Vigna unguiculata (L.) Walp.) Genotypes: Deep Study Using RNAseq Approach

Affiliations

Contrast Relative Humidity Response of Diverse Cowpea (Vigna unguiculata (L.) Walp.) Genotypes: Deep Study Using RNAseq Approach

Ekaterina A Krylova et al. Int J Mol Sci. .

Abstract

Cowpea (Vigna unguiculata (L.) Walp.) is appreciated for its suitability for cultivation and obtaining good yields in relatively extreme farming conditions. It is resistant to high temperatures and drought. Moreover, food products prepared from Vigna are rich in many nutrients such as proteins, amino acids, carbohydrates, minerals, fiber, vitamins, and other bioactive compounds. However, in East and Southeast Asia, where the products of this crop are in demand, the climate is characterized by excessive humidity. Under these conditions, the vast majority of cowpea varieties tend to have indeterminate growth (elongated shoot length) and are unsuitable for mechanized harvesting. The molecular mechanisms for tolerance to high relative humidity remain the least studied in comparison with those for other abiotic stress factors (drought, heat, cold, flooding, etc.). The purpose of the work was to reveal and investigate differentially expressed genes in cowpea accessions having contrasting growth habits (determinate and indeterminate) under humid and drought conditions. We performed RNA-seq analysis using selected cowpea accessions from the VIR collection. Among the genotypes used, some have significant changes in their plant architecture in response to high relative humidity, while others were tolerant to these conditions. In total, we detected 1697 upregulated and 1933 downregulated genes. The results showed that phytohormone-related genes are involved in cowpea response to high relative humidity. DEGs associated with jasmonic acid signaling are proposed to be key contributors in the maintenance of compact architecture under humid conditions.

Keywords: cowpea; differentially expressed gene; high relative humidity; transcriptomics.


Conflict of interest statement

The authors declare no conflicts of interest.

Figures

Figure 1
Figure 1
Principal component analysis (PCA) plot of all expressed genes in the RNA–seq data. The X-axis indicates the first principal component; the Y-axis indicates the second principal component. The percentage of variance explained by each PC is shown in each case. Rose color—control group (the relative humidity was equal to 60%), blue color—experimental group (the relative humidity—90%). Analysis was performed with the DESeq2 package version 1.38.3.
Figure 2
Figure 2
Volcano plot representing 24,350 differentially expressed genes. The X-axis indicates the log2-transformed gene expression fold changes between control group and experimental group of cowpea accessions. The Y-axis indicates the log10-transformed p-value. Dashed lines indicate log2FC and p-value thresholds. The scattered points represent each gene. Significant differentially upregulated genes are highlighted in red, significant differentially downregulated genes are highlighted in blue. Genes with a nonsignificant log2FC value and nonsignificant p-value are highlighted in black.
Figure 3
Figure 3
Number of DEGs identified in a comparison between the control and experimental groups for each cowpea accession.
Figure 4
Figure 4
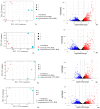
Principal component analysis (PCA) plots and volcano plots of expressed genes in the RNA-seq data for four comparisons. (1a,1b) PCA plot and volcano plot for k6; (2a,2b) PCA plot and volcano plot for k642; (3a,3b) PCA plot and volcano plot for k1783; (4a,4b) PCA plot and volcano plot for k2056. The X-axis on the PCA plots indicates the first principal component; the Y-axis indicates the second principal component. The percentage of variance explained by each PC is shown in each case. Rose color—control group (the relative humidity was equal to 60%), blue color—experimental group (the relative humidity—90%). Analysis was performed with the DESeq2 package version 1.38.3. The X-axis on the volcano plots indicates the log2-transformed gene expression fold changes between the control group and experimental group of cowpea accession. The Y-axis indicates the log10-transformed p-value. Dashed lines indicate log2FC and p-value thresholds. The scattered points represent each gene. Significantly differentially upregulated genes are highlighted in red, and significantly differentially downregulated genes are high-lighted in blue. Genes with a nonsignificant log2FC value and nonsignificant p-value are highlighted in black.
Figure 5
Figure 5
Venn diagrams representing the overlap between DEGs identified in four cowpea accessions in the control and experimental groups (two relative humidity conditions): (a) upregulated genes and (b) downregulated genes. Accessions are marked by different colors in letters.
Figure 6
Figure 6
GO enrichment analysis of the (a) upregulated genes and (b) downregulated genes identified in four cowpea accessions in the control and experimental groups (two relative humidity conditions). For the BP categories, the top 50 GO terms are presented.
Figure 7
Figure 7
Number of DEGs associated with plant hormone biosynthesis, metabolism, and signal transduction pathways. Genes identified in four cowpea accessions in the control and experimental groups (two relative humidity conditions): (a) upregulated genes and (b) downregulated genes.
Figure 8
Figure 8
qRT-PCR validation of nine DEGs for k-2056 in high RH (experimental) versus low RH (control). Data were normalized to the expression of VuUBQ10 (Vigun07g244400) encoding ubiquitin. Each sample was amplified in three technical replicates. Significant differences between the mean values are indicated (* p ≤ 0.001, ** p ≤ 0.05) (t-test).
Figure 9
Figure 9
Cowpea accessions k-2056 (a,c) and k-642 (b,d) in two climatic chambers: (a,b) 60% RH (control group), (c,d) 90% RH (experimental group). The formation of climbing shoot for k-642 in high RH was observed (d), and for k-2056, there was no formation of such shoots (c).

Similar articles

Cited by

References

    1. Timko M.P., Ehlers J.D., Roberts P.A. Cowpea. In: Kole C., editor. Genome Mapping and Molecular Breeding in Plants. Pulses, Sugar and Tuber Crops. Volume 3. Springer; Berlin/Heidelberg, Germany: 2007. pp. 49–67.
    1. Gerrano A.S., Adebola P.O., van Rensburg W.S.J., Venter S.L. Genetic Variability and Heritability Estimates of Nutritional Composition in the Leaves of Selected Cowpea Genotypes [Vigna unguiculata (L.) Walp] HortScience. 2015;50:1435–1440. doi: 10.21273/HORTSCI.50.10.1435. - DOI
    1. Gerrano A.S., van Rensburg W.S.J., Venter S.L., Shargie N.G., Amelework B.A., Shimelis H.A., Labuschagne M.T. Selection of Cowpea Genotypes Based on Grain Mineral and Total Protein Content. Acta Agric. Scand. Sect. B Soil Plant Sci. 2019;69:155–166. doi: 10.1080/09064710.2018.1520290. - DOI
    1. Gerrano A.S., van Rensburg W.S.J., Adebola P.O. Nutritional Composition of Immature Pods in Selected Cowpea [Vigna unguiculata (L.) Walp.] Genotypes in South Africa. Aust. J. Crop Sci. 2017;11:134–141. doi: 10.21475/ajcs.17.11.02.p72. - DOI
    1. Perchuk I., Shelenga T., Gurkina M., Miroshnichenko E., Burlyaeva M. Composition of Primary and Secondary Metabolite Compounds in Seeds and Pods of Asparagus Bean (Vigna unguiculata (L.) Walp.) from China. Molecules. 2020;25:3778. doi: 10.3390/molecules25173778. - DOI - PMC - PubMed

LinkOut - more resources