. 2024 Oct 18;25(20):11205.
doi: 10.3390/ijms252011205.

Identification and Copy Number Variant Analysis of Enhancer Regions of Genes Causing Spinocerebellar Ataxia

Affiliations

Identification and Copy Number Variant Analysis of Enhancer Regions of Genes Causing Spinocerebellar Ataxia

Fatemeh Ghorbani et al. Int J Mol Sci. .

Abstract

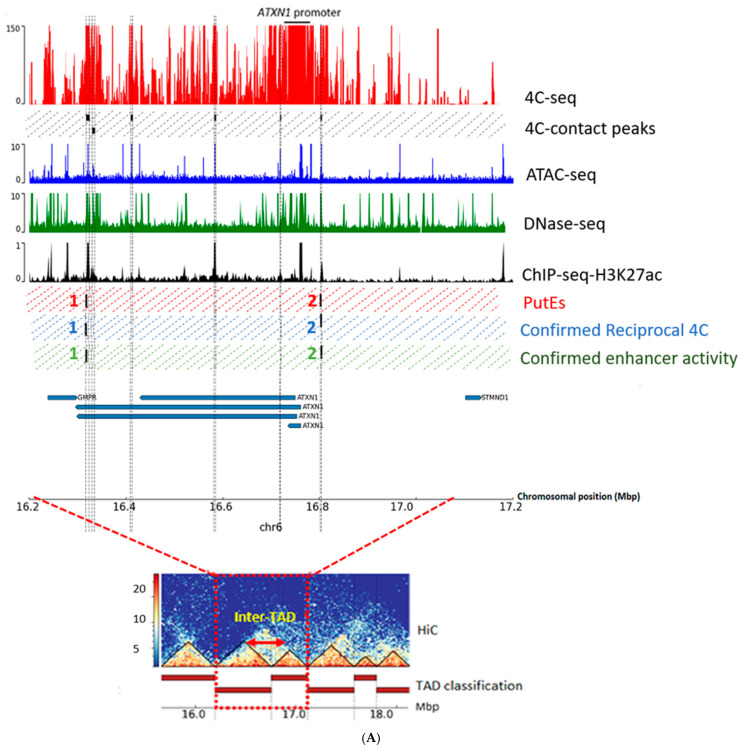
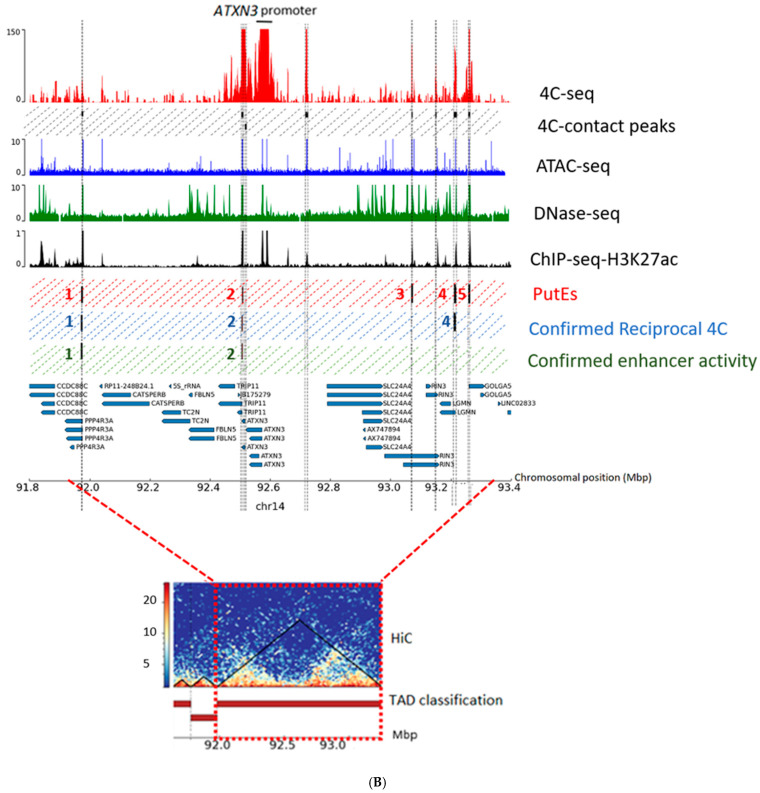
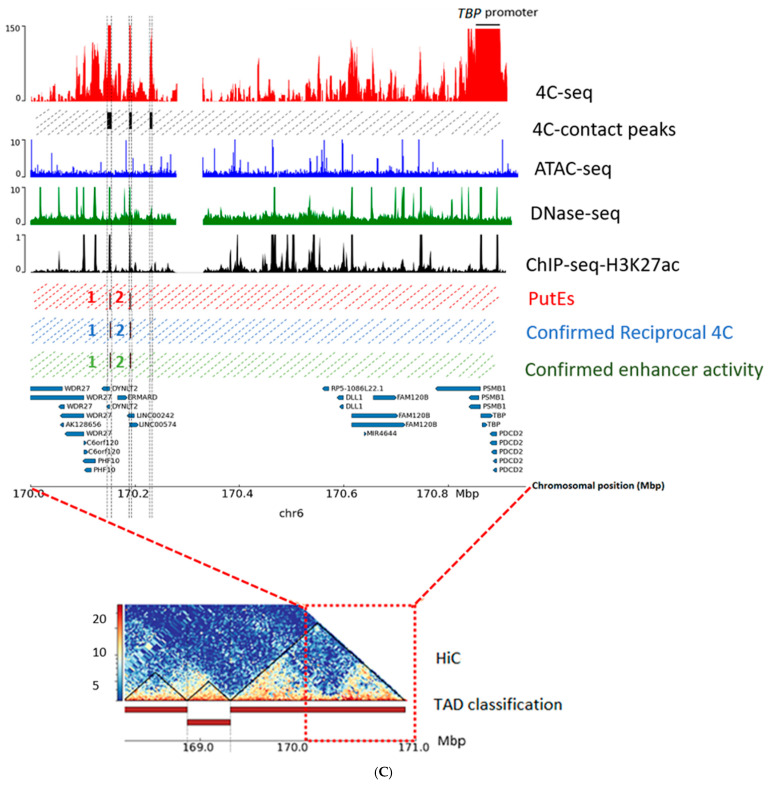
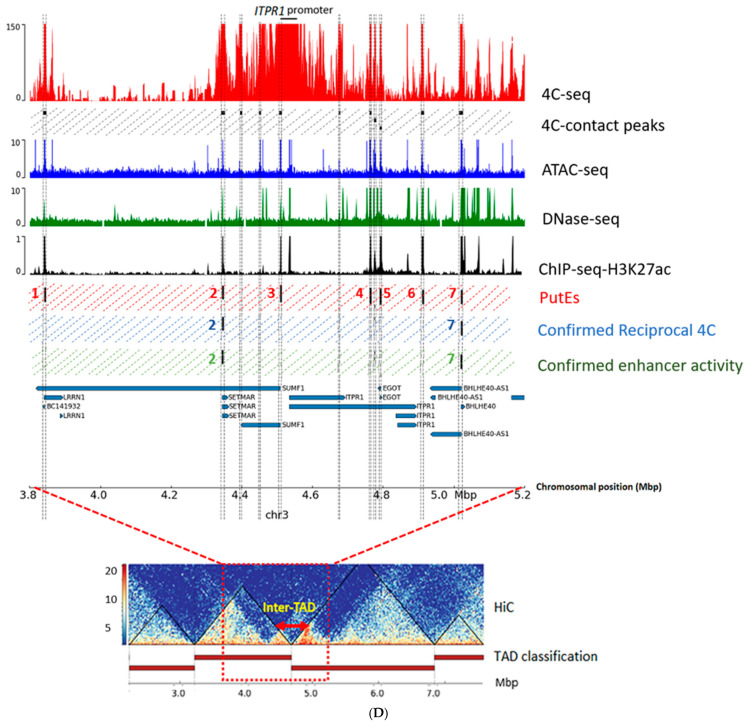
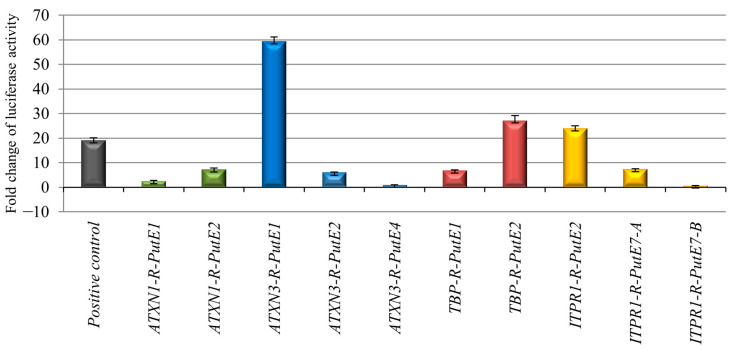
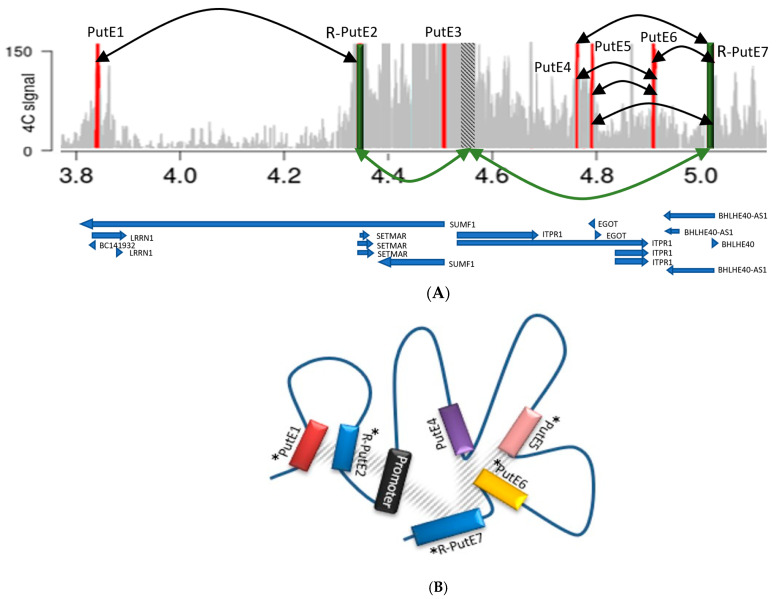
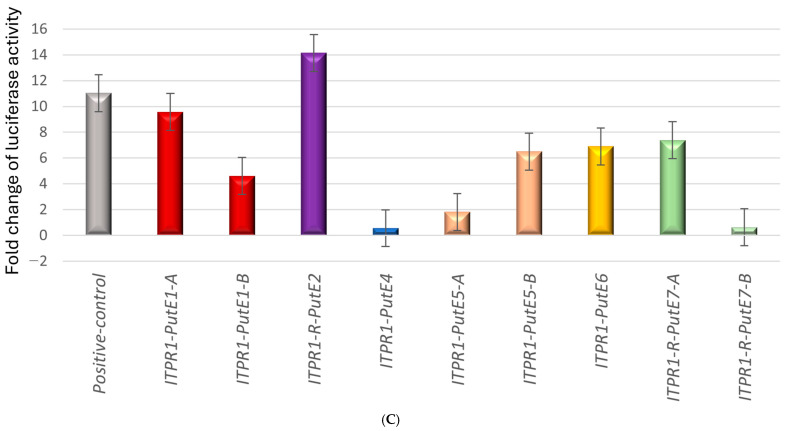
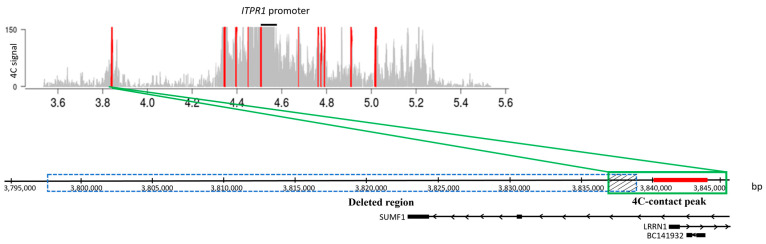
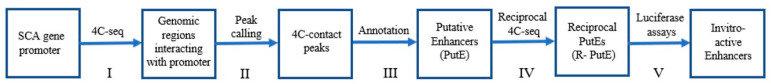
Currently, routine diagnostics for spinocerebellar ataxia (SCA) look for polyQ repeat expansions and conventional variations affecting the proteins encoded by known SCA genes. However, ~40% of the patients still remain without a genetic diagnosis after routine tests. Increasing evidence suggests that variations in the enhancer regions of genes involved in neurodegenerative disorders can also cause disease. Since the enhancers of SCA genes are not yet known, it remains to be determined whether variations in these regions are a cause of SCA. In this pilot project, we aimed to identify the enhancers of the SCA genes ATXN1, ATXN3, TBP and ITPR1 in the human cerebellum using 4C-seq, publicly available datasets, reciprocal 4C-seq, and luciferase assays. We then screened these enhancers for copy number variants (CNVs) in a cohort of genetically undiagnosed SCA patients. We identified two active enhancers for each of the four SCA genes. CNV analysis did not reveal any CNVs in the enhancers of the four SCA genes in the genetically undiagnosed SCA patients. However, in one patient, we noted a CNV deletion with an unknown clinical significance near one of the ITPR1 enhancers. These results not only reveal elements involved in SCA gene regulation but can also lead to the discovery of novel SCA-causing genetic variants. As enhancer variations are being increasingly recognized as a cause of brain disorders, screening the enhancers of ATXN1, ATXN3, TBP and ITPR1 for variations other than CNVs and identifying and screening enhancers of other SCA genes might elucidate the genetic cause in undiagnosed patients.

Keywords: 4C-seq; enhancer; genetic diagnosis; spinocerebellar ataxia.


Conflict of interest statement

The authors declare no conflicts of interest.

Figures

Figure 1
Figure 1
Identification of enhancers of (A) ATXN1, (B) ATXN3, (C) TBP, and (D) ITPR1 in the human cerebellum. The red track shows the 4C-seq data generated for the promoter of the corresponding gene. Black boxes show genomic regions significantly interacting with the promoters (4C-contact peaks). Blue, green, and black tracks show publicly available human cerebellum datasets for ATAC-seq, Dnase-seq, and ChIP-seq for H3K27ac, respectively. Red, blue, and green dashed boxes represent, respectively, putative enhancers (PutEs), PutEs confirmed to interact with their associated promoter through reciprocal 4C-seq (R-PutEs), and R-PutEs confirmed to have enhancer activity. The bottom track shows the genomic coordinates and the genes (UCSC gene track; hg19). TADs obtained from the human cerebellum HiC data are depicted in the bottom plot.
Figure 1
Figure 1
Identification of enhancers of (A) ATXN1, (B) ATXN3, (C) TBP, and (D) ITPR1 in the human cerebellum. The red track shows the 4C-seq data generated for the promoter of the corresponding gene. Black boxes show genomic regions significantly interacting with the promoters (4C-contact peaks). Blue, green, and black tracks show publicly available human cerebellum datasets for ATAC-seq, Dnase-seq, and ChIP-seq for H3K27ac, respectively. Red, blue, and green dashed boxes represent, respectively, putative enhancers (PutEs), PutEs confirmed to interact with their associated promoter through reciprocal 4C-seq (R-PutEs), and R-PutEs confirmed to have enhancer activity. The bottom track shows the genomic coordinates and the genes (UCSC gene track; hg19). TADs obtained from the human cerebellum HiC data are depicted in the bottom plot.
Figure 2
Figure 2
Fold change in the luciferase activity of the R-PutEs of ATXN1, ATXN3, TBP, and ITPR1. Fold change is expressed as the ratio of the normalized luciferase activity (firefly/Renilla) of the candidate region to that of the negative control (pGL4.23 firefly luciferase reporter vector with a 1479 bp stuffer DNA). A previously reported validated enhancer was used as a positive control. Fold change values are based on the means of three independent experiments. Standard deviations are shown as error bars. Each color represents the R-PutEs of a gene.
Figure 3
Figure 3
Analysis of the PutE–R-PutE interactions for ITPR1. (A) 4C-seq and reciprocal 4C-seq data for the ITPR1 promoter and PutEs revealed mutual interactions between PutEs and R-PutEs. Red bars: PutEs. Green bars: R-PutEs. Dashed bar: ITPR1 promoter. Green arrows: mutual interaction between the ITPR1 promoter and R-PutEs. Black arrows: mutual interactions between PutEs and R-PutEs. Chromosomal locations and gene annotations are indicated underneath the figure. (B) A schematic representation of the hypothetical interactions between ITPR1 PutEs and R-PutEs. Only R-PutE2 and R-PutE7 mutually interact with the ITPR1 promoter. Reciprocal 4C-seq revealed significant interactions between PutE1, R-PutE2, PutE4, PutE5, PutE6, and R-PutE7. Asterisks indicate PutEs and R-PutEs which showed an increase in luciferase activity. Mutual interactions between PutEs and R-PutEs are shown as gray hatching. (C) Fold change in the luciferase activity of PutE1, R-PutE2, PutE4, PutE5, PutE6, and R-PutE7. Fold change is expressed as the ratio of normalized luciferase activity (firefly/Renilla) of the candidate region to that of the negative control (pGL4.23 firefly luciferase reporter vector with a 1479 bp stuffer DNA). A previously reported validated enhancer was used as a positive control. Fold change values are based on the means of three independent experiments. Standard deviations are shown as error bars. Each color represents one of the R-PutEs/PutEs of the ITPR1 gene.
Figure 3
Figure 3
Analysis of the PutE–R-PutE interactions for ITPR1. (A) 4C-seq and reciprocal 4C-seq data for the ITPR1 promoter and PutEs revealed mutual interactions between PutEs and R-PutEs. Red bars: PutEs. Green bars: R-PutEs. Dashed bar: ITPR1 promoter. Green arrows: mutual interaction between the ITPR1 promoter and R-PutEs. Black arrows: mutual interactions between PutEs and R-PutEs. Chromosomal locations and gene annotations are indicated underneath the figure. (B) A schematic representation of the hypothetical interactions between ITPR1 PutEs and R-PutEs. Only R-PutE2 and R-PutE7 mutually interact with the ITPR1 promoter. Reciprocal 4C-seq revealed significant interactions between PutE1, R-PutE2, PutE4, PutE5, PutE6, and R-PutE7. Asterisks indicate PutEs and R-PutEs which showed an increase in luciferase activity. Mutual interactions between PutEs and R-PutEs are shown as gray hatching. (C) Fold change in the luciferase activity of PutE1, R-PutE2, PutE4, PutE5, PutE6, and R-PutE7. Fold change is expressed as the ratio of normalized luciferase activity (firefly/Renilla) of the candidate region to that of the negative control (pGL4.23 firefly luciferase reporter vector with a 1479 bp stuffer DNA). A previously reported validated enhancer was used as a positive control. Fold change values are based on the means of three independent experiments. Standard deviations are shown as error bars. Each color represents one of the R-PutEs/PutEs of the ITPR1 gene.
Figure 4
Figure 4
Schematic representation of the deleted region in one patient and its overlap with the 4C-contact peak of ITPR1. The upper plot shows the significant 4C-contact peaks (red bars) of the ITPR1 promoter. The lower plot shows the deleted region in the patient (GRCh37: chr3:3,797,792–3,838,896; blue dotted box), which partly overlaps (dashed box) the broad 4C-contact peak (GRCh37: chr3:3,836,985–3,845,608; green box) of the ITPR1 promoter. PutE1 (red line in the lower plot), the active enhancer region delineated in the 4C-contact peak, does not overlap with the deleted region in the patient. Gene annotations are indicated underneath the figure. The deletion encompasses part of intron 11 from the old version of the SUMF1 transcript (NM_182760) but does not encompass the updated transcript (NM_182760.4).
Figure 5
Figure 5
Expression of ITPR1 in the blood of an SCA patient carrying a CNV deletion in a 4C-contact peak of the ITPR1 promoter compared to expression in three healthy individuals. The delta–delta Ct was used to determine the relative fold change in expression levels. Expression values are normalized to Control 1. The relative fold change in expression for each individual was based on the means of three independent replicates. Standard deviations are shown as error bars. Patient: 70-year-old female, Control 1: 64-year-old male, Control 2: 36-year-old male, Control 3: 43-year-old female.
Figure 6
Figure 6
Workflow used to identify enhancers of ATXN1, ATXN3, TBP and ITPR1 in the human cerebellum.

Similar articles

Cited by

References

    1. Sullivan R., Yau W.Y., O’Connor E., Houlden H. Spinocerebellar ataxia: An update. J. Neurol. 2019;266:533–544. doi: 10.1007/s00415-018-9076-4. - DOI - PMC - PubMed
    1. Koob M.D., Moseley M.L., Schut L.J., Benzow K.A., Bird T.D., Day J.W., Ranum L.P. An untranslated CTG expansion causes a novel form of spinocerebellar ataxia (SCA8) Nat. Genet. 1999;21:379–384. doi: 10.1038/7710. - DOI - PubMed
    1. Holmes S.E., O’Hearn E.E., McInnis M.G., Gorelick-Feldman D.A., Kleiderlein J.J., Callahan C., Margolis R.L. Expansion of a novel CAG trinucleotide repeat in the 5′ region of PPP2R2B is associated with SCA12. Nat. Genet. 1999;23:391–392. doi: 10.1038/70493. - DOI - PubMed
    1. Seixas A.I., Loureiro J.R., Costa C., Ordóñez-Ugalde A., Marcelino H., Oliveira C.L., Silveira I. A pentanucleotide ATTTC repeat insertion in the non-coding region of DAB1, mapping to SCA37, causes spinocerebellar ataxia. Am. J. Hum. Genet. 2017;101:87–103. doi: 10.1016/j.ajhg.2017.06.007. - DOI - PMC - PubMed
    1. McClymont S.A., Hook P.W., Soto A.I., Reed X., Law W.D., Kerans S.J., McCallion A.S. Parkinson-associated SNCA enhancer variants revealed by open chromatin in mouse dopamine neurons. Am. J. Hum. Genet. 2018;103:874–892. doi: 10.1016/j.ajhg.2018.10.018. - DOI - PMC - PubMed

LinkOut - more resources