. 2024 Oct 18;25(20):11199.
doi: 10.3390/ijms252011199.

Human iPSCs from Aged Donors Retain Their Mitochondrial Aging Signature

Affiliations

Human iPSCs from Aged Donors Retain Their Mitochondrial Aging Signature

Imane Lejri et al. Int J Mol Sci. .

Abstract

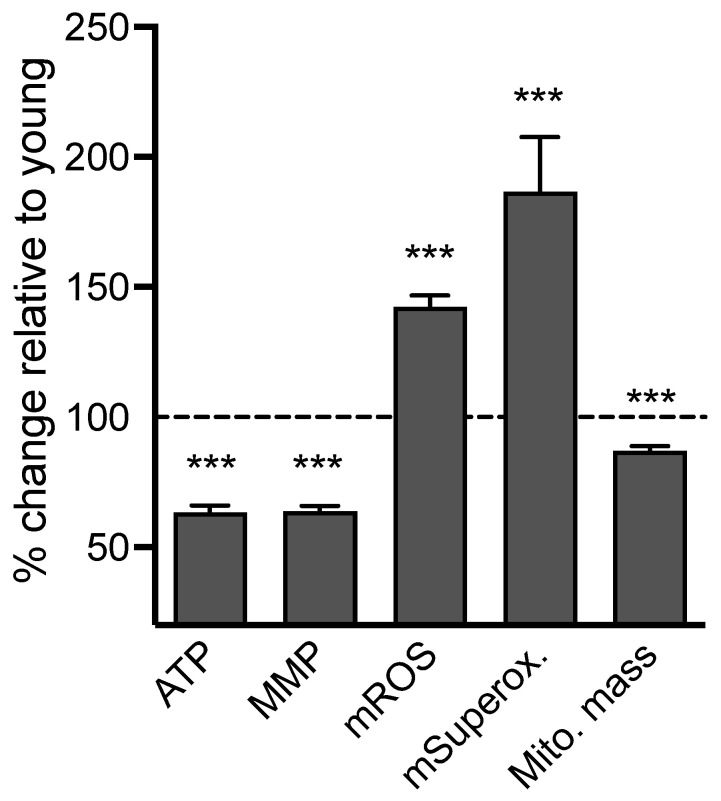
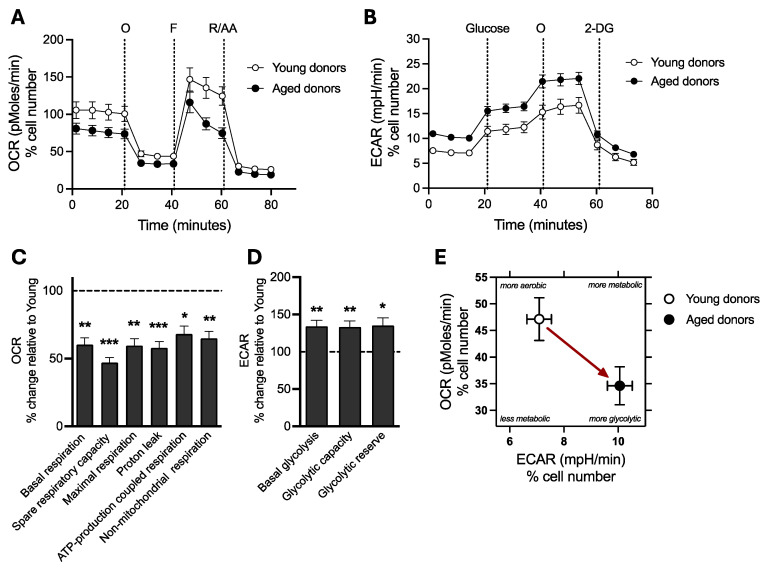
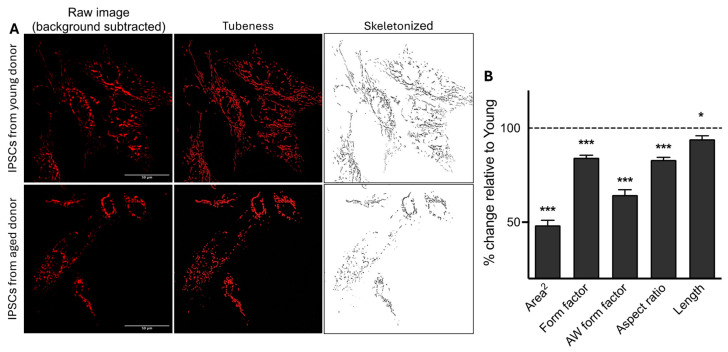
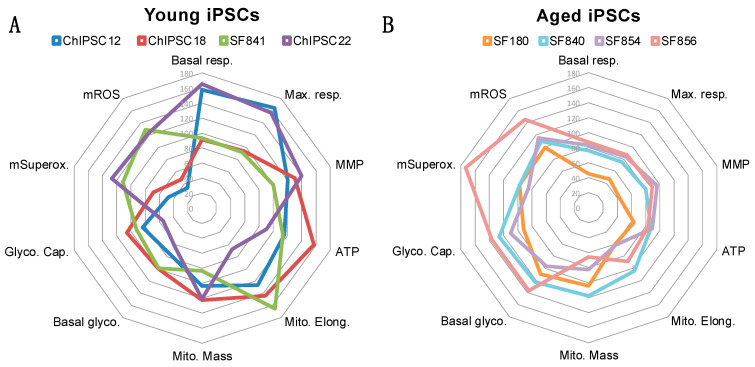
Aging represents the leading risk factor for developing neurodegenerative disorders. One of the nine hallmarks of aging is mitochondrial dysfunction. Age-related mitochondrial alterations have been shown to affect mitochondrial energy metabolism, reduction-oxidation homeostasis, and mitochondrial dynamics. Previous reports have shown that induced pluripotent stem cells (iPSCs) from aged donors do not keep the aging signature at the transcriptomic level. However, not all aspects of aging have been investigated, and especially not the mitochondria-related aging signature. Therefore, the present study compared the mitochondrial function in iPSCs from healthy aged donors compared to those of young donors. We addressed whether aged iPSCs may be used as drug-screening models of "aging in a dish" to identify therapies alleviating mitochondria aging. Compared to iPSCs from young donors, we demonstrate that iPSCs from aged donors show impaired mitochondrial bioenergetics and exhibit a rise in reactive oxygen species generation. Furthermore, aged iPSCs present a lower mitochondrial mass and alterations in the morphology of the mitochondrial network when compared to iPSCs from young donors. This study provides the first evidence that the aging phenotype is present at the mitochondrial level in iPSCs from aged donors, ranging from bioenergetics to mitochondrial network morphology. This model might be used to screen mitochondria-targeting drugs to promote healthy aging at the mitochondrial level.

Keywords: aging; bioenergetics; human-induced pluripotent stem cells; mitochondria; mitochondrial morphology; oxidative stress.


Conflict of interest statement

The authors declare no conflicts of interest.

Figures

Figure 1
Figure 1
Bioenergetic readouts in iPSCs from young versus old donors. Readouts include ATP generation (ATP), mitochondrial membrane potential (MMP), mitochondrial ROS (DHR), mitochondrial superoxide anion (MitoSOX) levels, and mitochondrial mass. Data were normalized on the CellTracker blue signal, an indicator of living cell surface area, and are shown as the percentage of iPSCs derived from young donors. Values represent the mean ± SEM of 10–12 replicates/donor/readout, for four young and four aged donors, and three independent experiments (Total n = 123–150 replicates/group), and are shown as the percentage of iPSCs derived from young donors. (dashed line). Student t-test between iPSCs from young vs. aged donors *** p < 0.001.
Figure 2
Figure 2
Analysis of mitochondrial respiration and cellular glycolysis in young versus old iPSCs. (A) oxygen consumption rate (OCR) and (B) extracellular acidification rate (ECAR) were measured before and after the sequential injection of specific modulators (A: Mito Stress test and B: Glycolysis stress test) using the Seahorse XF HS Mini Analyser. (C) OCR-based respiratory parameters, including basal respiration, spare respiratory capacity, maximal respiration, proton leak, ATP-production coupled respiration, and non-mitochondrial oxygen consumption, were calculated in young and aged iPSCs. (D) ECAR-based glycolysis parameters, including basal glycolysis, glycolytic capacity, and glycolytic reserve, were calculated in young and aged iPSCs. (E) Representative bioenergetics phenotype of young and aged iPSCs is depicted as the mean of the basal ECAR on the abscissa and the mean of the basal OCR on the ordinate. The red arrow indicates a metabolic shift from a more aerobic phenotype to a more glycolytic phenotype between young and aged cells. (AE) All the data were normalized on the CellTracker blue signal, an indicator of living cell surface area. (C,D) Values represent the mean ± SEM of three independent tests (n = 15–17 replicates per condition for OCR evaluation, n = 24–30 replicates for ECAR evaluation, four human iPSCs from young donors or four human iPSCs from aged donors per group and are shown as the percentage of iPSCs derived from young donors. (dashed line). * p < 0.05, ** p < 0.01, *** p < 0.001, Student t-test between iPSCs from young donors vs. iPSCs from aged donors. AA: antimycin A, 2-DG: 2-deoxyglucose, ECAR: Extracellular acidification rate, F: FCCP, OCR: Oxygen Consumption Rate, O: oligomycin, R: rotenone.
Figure 3
Figure 3
Impact of age on the mitochondrial network morphology in iPSCs. (A) Representative z-projection microscopy images of the mitochondrial network stained with the CMXROS Mitotracker Red in iPSCs from young and aged donors (×94.5 magnification). The left panels display the raw images after background subtraction (rolling ball radius = 20 pixels). The middle panels (tubeness) display the same pictures after processing the morphometry macro on the FIJI software. The right panels (skeletonized) present binary images of the mitochondrial network (in black) after further image processing in FIJI using the “skeletonize” function. (B) Quantification of mitochondrial network morphology parameters, including the area2 (average of the size of mitochondria), form factor (elongation of mitochondria), area-weighted (AW) form factor (a variant of form factor with a bias towards larger mitochondria), aspect ratio (branching), and mitochondria length in iPSCs from young and aged donors. Values represent the mean ± SEM of three independent experiments (n = 85–90 replicates per condition, four human iPSCs from young donors or four human iPSCs from aged donord per group), and are shown as the percentage of iPSCs derived from young donors (dashed line). * p < 0.05, *** p < 0.001, Student t-test iPSCs from young donors vs. iPSCs from aged donors.
Figure 4
Figure 4
Radar plots summarizing the key data from each young and aged donor. (A) Summary of data obtained in iPSCs derived from four young donors. (B) Summary of data obtained in iPSCs derived from four aged donors. The radar plots were generated with Excel. The data used to create the radar plot are represented as a percentage of the mean young (A) or as a percentage of the mean aged (B). Basal glyco.: basal glycolysis; Basal resp.: basal respiration; Glyco. Cap.: Glycolytic capacity; Max. resp.: Maximal respiration; Mito. Elong.: Mitochondrial elongation; Mito. Mass: mitochondrial mass; MMP: mitochondrial membrane potential; mROS: mitochondrial ROS; mSuperox.: mitochondrial superoxide anion radicals.

References

    1. Kauppila T.E.S., Kauppila J.H.K., Larsson N.G. Mammalian Mitochondria and Aging: An Update. Cell Metab. 2017;25:57–71. doi: 10.1016/j.cmet.2016.09.017. - DOI - PubMed
    1. Azam S., Haque M.E., Balakrishnan R., Kim I.S., Choi D.K. The Ageing Brain: Molecular and Cellular Basis of Neurodegeneration. Front. Cell Dev. Biol. 2021;9:683459. doi: 10.3389/fcell.2021.683459. - DOI - PMC - PubMed
    1. Lopez-Otin C., Blasco M.A., Partridge L., Serrano M., Kroemer G. Hallmarks of aging: An expanding universe. Cell. 2023;186:243–278. doi: 10.1016/j.cell.2022.11.001. - DOI - PubMed
    1. Grimm A., Eckert A. Brain aging and neurodegeneration: From a mitochondrial point of view. J. Neurochem. 2017;143:418–431. doi: 10.1111/jnc.14037. - DOI - PMC - PubMed
    1. Taormina G., Ferrante F., Vieni S., Grassi N., Russo A., Mirisola M.G. Longevity: Lesson from Model Organisms. Genes. 2019;10:518. doi: 10.3390/genes10070518. - DOI - PMC - PubMed

Substances

LinkOut - more resources