. 2024 Oct 18;25(20):11228.
doi: 10.3390/ijms252011228.

Single-Nuclei Transcriptome Profiling Reveals Intra-Tumoral Heterogeneity and Characterizes Tumor Microenvironment Architecture in a Murine Melanoma Model

Affiliations

Single-Nuclei Transcriptome Profiling Reveals Intra-Tumoral Heterogeneity and Characterizes Tumor Microenvironment Architecture in a Murine Melanoma Model

Sushant Parab et al. Int J Mol Sci. .

Abstract

Malignant melanoma is an aggressive cancer, with a high risk of metastasis and mortality rates, characterized by cancer cell heterogeneity and complex tumor microenvironment (TME). Single cell biology is an ideal and powerful tool to address these features at a molecular level. However, this approach requires enzymatic cell dissociation that can influence cellular coverage. By contrast, single nucleus RNA sequencing (snRNA-seq) has substantial advantages including compatibility with frozen samples and the elimination of a dissociation-induced, transcriptional stress response. To better profile and understand the functional diversity of different cellular components in melanoma progression, we performed snRNA-seq of 16,839 nuclei obtained from tumor samples along the growth of murine syngeneic melanoma model carrying a BRAFV600E mutation and collected 9 days or 23 days after subcutaneous cell injection. We defined 11 different subtypes of functional cell clusters among malignant cells and 5 different subsets of myeloid cells that display distinct global transcriptional program and different enrichment in early or advanced stage of tumor growth, confirming that this approach was useful to accurately identify intratumor heterogeneity and dynamics during tumor evolution. The current study offers a deep insight into the biology of melanoma highlighting TME reprogramming through tumor initiation and progression, underlying further discovery of new TME biomarkers which may be potentially druggable.

Keywords: heterogeneity; melanoma; single-nuclei sequencing; transcriptome; tumor microenvironment.


Conflict of interest statement

The authors declare no conflicts of interest.

Figures
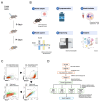
Figure 1
Figure 1
Schematic diagram of study design workflow (A) Syngeneic D4M melanoma model. (B) Graphical representation of the experimental setup for nuclei purification and sequencing. The figure was created with BioRender. (C) Gating strategy for FACS isolation of a single nucleus isolated using Chromium Nuclei Isolation Kit. Single DAPI⁺ events were considered nuclei. (D) Computational pipeline.
Figure 2
Figure 2
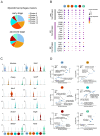
snRNA-seq of melanoma syngeneic tumors identifies main cell populations: (A) Left panel, clustering of 16,839 high-quality nuclei from D4M melanoma syngeneic tumor samples (n = 4) represented on a two-dimensional Uniform Manifold Approximation and Projection (UMAP) plot and grouped into six major cell types. Upper right panel, UMAP plot showing the distribution originating from early stage (n = 2) or advanced stage tumor samples (n = 2). (B) Bar plot showing the fraction of each cell type (melanoma cancer cells, myeloid cells, fibroblasts, T cells, endothelial cells, lymphatic endothelial cells) according to the origin samples, early stage or advanced stage tumors. (C) Feature plot assessing the gene expression levels of the selected cell-type specific marker genes: Pax3 and Etv1 (melanoma cancer cells); Adgre1, Itgam (myeloid/macrophage cell population); Cdh11 and Loxl1 (fibroblasts); Cd247 and Ilr2b (T cells); Cdh5 and Vwf (endothelial cells); Flt4 (lymphatic endothelial cells). Gene expression patterns are projected onto UMAP. Scale: log-transformed gene expression. (D) Heatmap showing the top five differentially expressed genes in each cluster indicating the main cell populations. Clusters are identified on the left y-axis and gene symbols are listed on the top x-axis. Red indicates up-regulation and blue indicates down-regulation. Scale: log2 fold change.
Figure 2
Figure 2
snRNA-seq of melanoma syngeneic tumors identifies main cell populations: (A) Left panel, clustering of 16,839 high-quality nuclei from D4M melanoma syngeneic tumor samples (n = 4) represented on a two-dimensional Uniform Manifold Approximation and Projection (UMAP) plot and grouped into six major cell types. Upper right panel, UMAP plot showing the distribution originating from early stage (n = 2) or advanced stage tumor samples (n = 2). (B) Bar plot showing the fraction of each cell type (melanoma cancer cells, myeloid cells, fibroblasts, T cells, endothelial cells, lymphatic endothelial cells) according to the origin samples, early stage or advanced stage tumors. (C) Feature plot assessing the gene expression levels of the selected cell-type specific marker genes: Pax3 and Etv1 (melanoma cancer cells); Adgre1, Itgam (myeloid/macrophage cell population); Cdh11 and Loxl1 (fibroblasts); Cd247 and Ilr2b (T cells); Cdh5 and Vwf (endothelial cells); Flt4 (lymphatic endothelial cells). Gene expression patterns are projected onto UMAP. Scale: log-transformed gene expression. (D) Heatmap showing the top five differentially expressed genes in each cluster indicating the main cell populations. Clusters are identified on the left y-axis and gene symbols are listed on the top x-axis. Red indicates up-regulation and blue indicates down-regulation. Scale: log2 fold change.
Figure 3
Figure 3
snRNA-seq of murine melanoma D4M tumors identifies 21 different cell clusters. (A) snRNA-seq of nuclei isolated from murine melanoma D4M tumors (n = 4). Dimensionality reduction and identification of clusters of transcriptionally similar cells were performed in an unsupervised manner using Seurat package. (B) UMAP plot showing the distribution originated from early stage (n = 2) or advanced stage tumor samples (n = 2).
Figure 4
Figure 4
snRNA-seq reveal heterogeneity in melanoma cancer cells in murine melanoma D4M tumors. (A) Bar plot showing the fraction of each cluster (c0, c1, c2, c3, c4, c5, c6, c7, c11, c14, c19) associated to melanoma cancer cells within the total melanoma cancer cells, according to the origin samples, early stage (upper panel) or advanced stage tumors (bottom panel). (B) Heatmap showing the top 20 most up-regulated genes (ordered by decreasing p value) in each cluster defined in Figure 3A and selected enriched genes used for biological identification of melanoma cancer cells heterogeneity among each cluster associated to melanoma cancer cells. Scale: log2 fold change. The top bars in color label corresponding to melanoma cancer cell clusters. Top bars in grey indicate clusters associated with a TME. Normalized gene expressions are shown. Full gene list for each cluster can be found in Table S3. (C) Gene set enrichment analysis among melanoma tumor cell clusters using hallmark pathways. Heatmap of the enrichment scores produced from gene set enrichment analysis using hallmark pathways. Red indicates up-regulation and blue indicates down-regulation. Clusters are indicated on the x-axis.
Figure 4
Figure 4
snRNA-seq reveal heterogeneity in melanoma cancer cells in murine melanoma D4M tumors. (A) Bar plot showing the fraction of each cluster (c0, c1, c2, c3, c4, c5, c6, c7, c11, c14, c19) associated to melanoma cancer cells within the total melanoma cancer cells, according to the origin samples, early stage (upper panel) or advanced stage tumors (bottom panel). (B) Heatmap showing the top 20 most up-regulated genes (ordered by decreasing p value) in each cluster defined in Figure 3A and selected enriched genes used for biological identification of melanoma cancer cells heterogeneity among each cluster associated to melanoma cancer cells. Scale: log2 fold change. The top bars in color label corresponding to melanoma cancer cell clusters. Top bars in grey indicate clusters associated with a TME. Normalized gene expressions are shown. Full gene list for each cluster can be found in Table S3. (C) Gene set enrichment analysis among melanoma tumor cell clusters using hallmark pathways. Heatmap of the enrichment scores produced from gene set enrichment analysis using hallmark pathways. Red indicates up-regulation and blue indicates down-regulation. Clusters are indicated on the x-axis.
Figure 5
Figure 5
snRNA-seq reveals heterogeneity in myeloid/macrophage cells in murine melanoma D4M tumors. Gene expression signature of macrophages in murine D4M melanoma model. (A) Bar plot showing the proportion/fraction of each cluster (c8, c9, c12, c13, c15, c16) associated to myeloid cells within the total myeloid cells according to the origin samples, early stage (upper panel) or advanced stage tumors (bottom panel). (B) Dot plot heatmap showing the gene expression level of pan-macrophage, M1 macrophage, and M2 macrophage markers among clusters associated with myeloid cells (c8, c9, c12, c13, c15, c16). The color intensity of each dot represents the average level of marker gene expression, while the dot size reflects the percentage of the cells expressing the marker within the clusters. (C) Violin plots of log-transformed gene expression of selected genes showing statistically significant up-regulation in the indicated clusters associated with myeloid cells. (D) Gene ontology of differentially expressed genes among clusters associated with myeloid cells: c8, c9, c12, c13, c15, c16. The top 20 enriched GO biological processes and their associated fold enrichment and false discovery rate (FDR) are shown. Dot size correlates to the corresponding fold enrichment. A full report can be found in Table S5.
Figure 6
Figure 6
CellChat analysis reveals cell–cell interactions in murine melanoma D4M tumors. (A) Total number of interactions identified in every cluster predicted by Seurat integration. Strength or weight of every interaction which further confirms few clusters that have the maximum strong interactions within different cell populations. (B) Interactions found in different/individual myeloid clusters, from which cluster c12 has the maximum stronger interactions as compared to others. (C) Cell–cell interactions between different myeloid clusters and T cells. (D) Bubble plot highlights some unique ligand–receptor interactions between a myeloid cluster (c12) and T cells (c18).

References

    1. Wolchok J.D., Chiarion-Sileni V., Gonzalez R., Grob J.-J., Rutkowski P., Lao C.D., Cowey C.L., Schadendorf D., Wagstaff J., Dummer R., et al. Long-Term Outcomes With Nivolumab Plus Ipilimumab or Nivolumab Alone Versus Ipilimumab in Patients With Advanced Melanoma. J. Clin. Oncol. 2022;40:127–137. doi: 10.1200/JCO.21.02229. - DOI - PMC - PubMed
    1. Robert C., Grob J.J., Stroyakovskiy D., Karaszewska B., Hauschild A., Levchenko E., Chiarion Sileni V., Schachter J., Garbe C., Bondarenko I., et al. Five-Year Outcomes with Dabrafenib plus Trametinib in Metastatic Melanoma. N. Engl. J. Med. 2019;381:626–636. doi: 10.1056/NEJMoa1904059. - DOI - PubMed
    1. Ascierto P.A., Dréno B., Larkin J., Ribas A., Liszkay G., Maio M., Mandalà M., Demidov L., Stroyakovskiy D., Thomas L., et al. 5-Year Outcomes with Cobimetinib plus Vemurafenib in BRAFV600 Mutation-Positive Advanced Melanoma: Extended Follow-up of the coBRIM Study. Clin. Cancer Res. Off. J. Am. Assoc. Cancer Res. 2021;27:5225–5235. doi: 10.1158/1078-0432.CCR-21-0809. - DOI - PMC - PubMed
    1. Dummer R., Flaherty K.T., Robert C., Arance A., de Groot J.W.B., Garbe C., Gogas H.J., Gutzmer R., Krajsová I., Liszkay G., et al. COLUMBUS 5-Year Update: A Randomized, Open-Label, Phase III Trial of Encorafenib Plus Binimetinib Versus Vemurafenib or Encorafenib in Patients With BRAF V600–Mutant Melanoma. J. Clin. Oncol. 2022;40:4178–4188. doi: 10.1200/JCO.21.02659. - DOI - PMC - PubMed
    1. Grzywa T.M., Paskal W., Włodarski P.K. Intratumor and Intertumor Heterogeneity in Melanoma. Transl. Oncol. 2017;10:956–975. doi: 10.1016/j.tranon.2017.09.007. - DOI - PMC - PubMed

MeSH terms

Substances

LinkOut - more resources