. 2024 Oct 18;25(20):11232.
doi: 10.3390/ijms252011232.

Targeted Drug Screening Leveraging Senescence-Induced T-Cell Exhaustion Signatures in Hepatocellular Carcinoma

Affiliations

Targeted Drug Screening Leveraging Senescence-Induced T-Cell Exhaustion Signatures in Hepatocellular Carcinoma

Qi Qi et al. Int J Mol Sci. .

Abstract

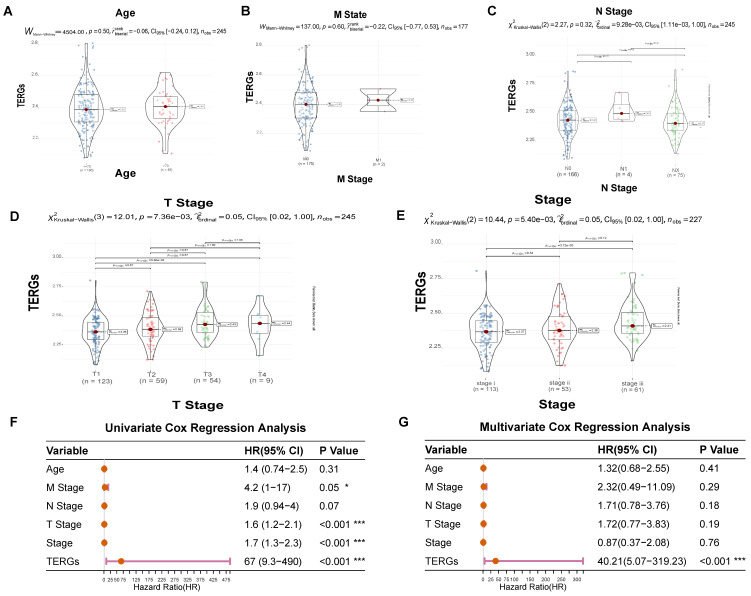
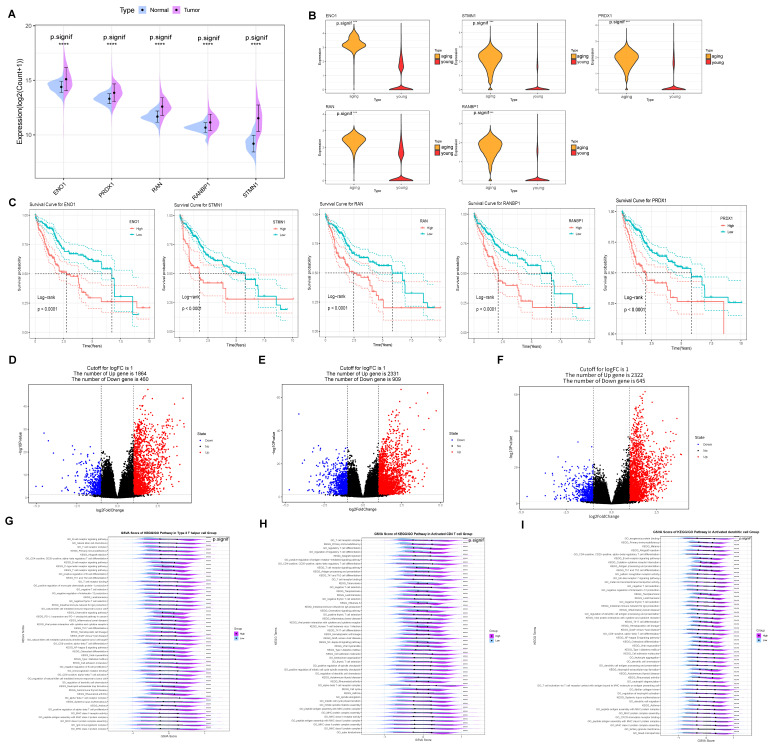
Hepatocellular carcinoma (HCC) is the sixth most prevalent cancer and a leading cause of cancer-related mortality globally, with most patients diagnosed at advanced stages and facing limited early treatment options. This study aimed to identify characteristic genes associated with T-cell exhaustion due to senescence in hepatocellular carcinoma patients, elucidating the interplay between senescence and T-cell exhaustion. We constructed prognostic models based on five signature genes (ENO1, STMN1, PRDX1, RAN, and RANBP1) linked to T-cell exhaustion, utilizing elastic net regression. The findings indicate that increased expression of ENO1 in T cells may contribute to T-cell exhaustion and Treg infiltration in hepatocellular carcinoma. Furthermore, molecular docking was employed to screen small molecule compounds that target the anti-tumor effects of these exhaustion-related genes. This study provides crucial insights into the diagnosis and treatment of hepatocellular carcinoma, establishing a strong foundation for the development of predictive biomarkers and therapeutic targets for affected patients.

Keywords: cellular senescence; combined targeted therapy; hepatocellular carcinoma; machine learning; single-cell RNA-seq; t cell exhaustion.


Conflict of interest statement

The authors declare that they have no competing interests in this section.

Figures

Figure 1
Figure 1
Construction of human hepatocellular carcinoma T-cell profiles at single-cell resolution. (A) Obtained subgroup clustering subgroups for seven cell types. (B) 170,000 T cells clustered together due to transcriptional similarity. (C) Seven cell clusters with expression levels of marker genes are shown. (D) Heatmap of the expression level of Marker genes from seven cell types.
Figure 2
Figure 2
Differential characterization of senescent and young T cell subsets. (A) Senescent and young T cell populations, and calculated exhaustion scores. (B) Significantly different. (C) The cytotoxicity score of the senescent group was significantly higher than that of the young group. (D) Significantly different. (E) The stressful score of the senescent group was significantly higher than that of the young group. (F) Significantly different. (G) The senescent T-cell subpopulation showed relatively high inflammation scores. (H) Significantly different. **** p < 0.0001.
Figure 3
Figure 3
Screening of gene sets highly associated with senescent T cells. (A) The senescent and young T cell differentiation trajectories. (B) The calculation was consistent with the monocle algorithm. (C) Verified the pseudotime axis of ssGSEA on the senescence scoring of a single sample. (D) The abundance of senescent and young T cells in the samples using data from 424 samples from the TCGA-LIHC cohort. (E) With 104 genes up-regulated in the senescent group. (F) The TOP50 feature genes were expressed as shown. (G) Significant difference in the proportion of senescent and young T cells in the tumor group. (H) The DEG differential gene calculation resulted in a heat map of expression between the two groups. **** p < 0.0001.
Figure 4
Figure 4
Establishment of model of T-cell prognostic exhaustion. (A) Gene expression in the training set. (B) Gene expression in the validation set. (C) The training set of ROC and Kaplan–Meier survival curves. (D) The validation set of ROC and Kaplan–Meier survival curves. (E) The nomogram of prognostic characteristics. (F) The nomogram calibration curves to predict the 1-, 3-, and 5-year survival rates.
Figure 5
Figure 5
TERGs are associated with a tumor-suppressive microenvironment. (A) ssGSEA results showed that there were eight types of immune cells. (B) Tregs cell infiltration was increased. (C) The higher immune component of the tumor microenvironment in the group with high T-cell exhaustion. (DH) Immune checkpoints (PD-L1, CTLA-4, LAG-3, CXCL13) and p16 with elevated expression in high TERGs.
Figure 6
Figure 6
The relationship between clinical features and exhaustion score. (AE) Age, M stage, N stage, T stage, and stage distribution of the patients in the high-risk and low-risk groups. (F) Univariate Cox Regression analysis and (G) Multivariate Cox Regression analysis of clinical information of TCGA cohorts (* p < 0.05; *** p < 0.001).
Figure 7
Figure 7
The function of five prognostic genes associated with senescent T cells. (A) ENO1 expression was up-regulated in the tumor group of TCGA cohorts and (B) significantly up-regulated in senescent T cells compared to the young group. (C) ENO1, STMN1, PRDX1, RANBP1, and RAN high expression in the Kaplan–Meier survival curves. (D) 1864 up-regulated in Type 2 T helper cell with the differential genes. (E) A total of 2331 up-regulated differential genes in activated CD4 T cells. (F) A total of 2322 up-regulated differential genes in activated dendritic cells. (G) ENO1 in Type 2 T helper by GSVA. (H) ENO1 in activated CD4 T cell by GSVA. (I) ENO1 in activated dendritic cell by GSVA. **** p < 0.0001.
Figure 8
Figure 8
Molecular docking of targeted drugs. (A) The docking results of ENO1 with Gentamicin. (B) The docking results of RAN with Ivermectin. (C) The docking results of PRDX1 with Osteotriol. (D) The docking results of PRDX1 with Astragaloside C.

References

    1. Llovet J.M., Kelley R.K., Villanueva A., Singal A.G., Pikarsky E., Roayaie S., Lencioni R., Koike K., Zucman-Rossi J., Finn R.S. Hepatocellular carcinoma. Nat. Rev. Dis. Primers. 2021;7:6. doi: 10.1038/s41572-020-00240-3. - DOI - PubMed
    1. Marquardt J.U., Andersen J.B., Thorgeirsson S.S. Functional and genetic deconstruction of the cellular origin in liver cancer. Nat. Rev. Cancer. 2015;15:653–667. doi: 10.1038/nrc4017. - DOI - PubMed
    1. Chidambaranathan-Reghupaty S., Fisher P.B., Sarkar D. Hepatocellular Carcinoma (HCC): Epidemiology, Etiology and Molecular Classification. Adv. Cancer Res. 2021;149:1–61. - PMC - PubMed
    1. Bruix J., Hessheimer A.J., Forner A., Boix L., Vilana R., Llovet J.M. New aspects of diagnosis and therapy of hepatocellular carcinoma. Oncogene. 2006;25:3848–3856. doi: 10.1038/sj.onc.1209548. - DOI - PubMed
    1. Sun J., Yin T., Zhang X., Lu X. Therapeutic advances for patients with intermediate hepatocellular carcinoma. J. Cell. Physiol. 2019;234:12116–12121. doi: 10.1002/jcp.28019. - DOI - PubMed

MeSH terms

Substances

LinkOut - more resources