. 2024 Oct 19;25(20):11242.
doi: 10.3390/ijms252011242.

Downregulation of the GhROD1 Gene Improves Cotton Fiber Fineness by Decreasing Acyl Pool Saturation, Stimulating Small Heat Shock Proteins (sHSPs), and Reducing H2O2 Production

Affiliations

Downregulation of the GhROD1 Gene Improves Cotton Fiber Fineness by Decreasing Acyl Pool Saturation, Stimulating Small Heat Shock Proteins (sHSPs), and Reducing H2O2 Production

Bo Ding et al. Int J Mol Sci. .

Abstract

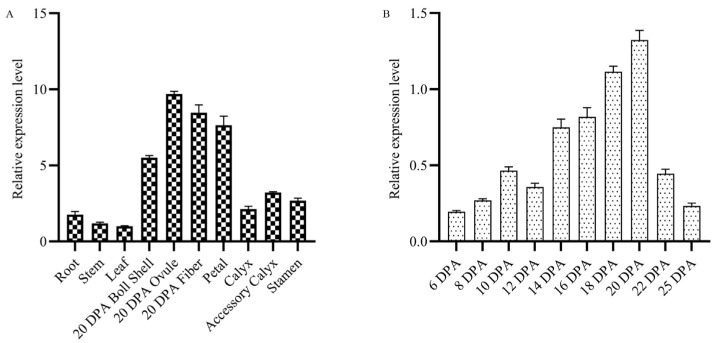
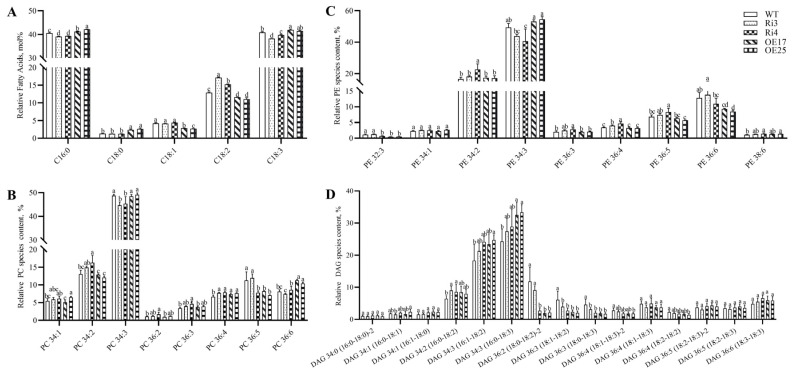
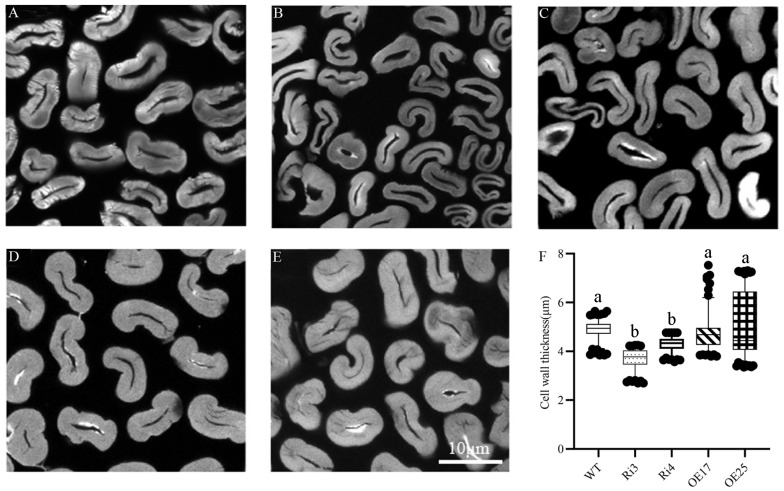
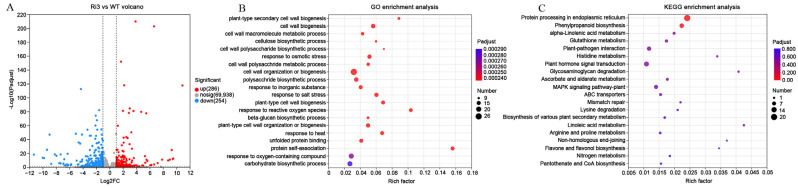
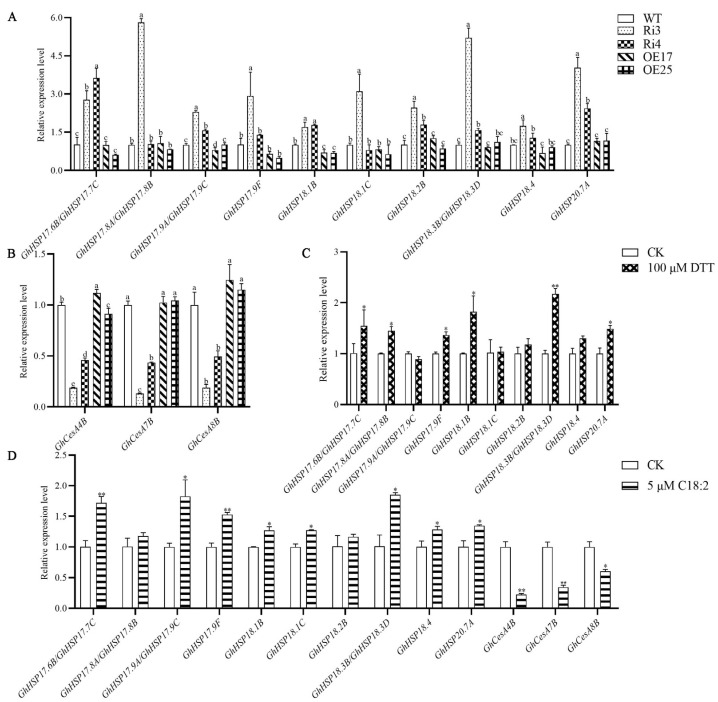
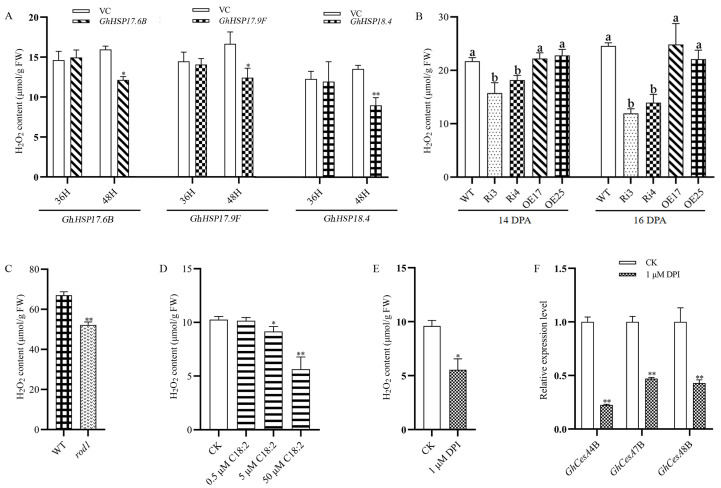
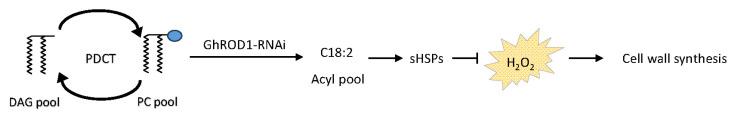
Cotton fiber is one of the most important natural fiber sources in the world, and lipid metabolism plays a critical role in its development. However, the specific role of lipid molecules in fiber development and the impact of fatty acid alterations on fiber quality remain largely unknown. In this study, we demonstrate that the downregulation of GhROD1, a gene encoding phosphatidylcholine diacylglycerol cholinephosphotransferase (PDCT), results in an improvement of fiber fineness. We found that GhROD1 downregulation significantly increases the proportion of linoleic acid (18:2) in cotton fibers, which subsequently upregulates genes encoding small heat shock proteins (sHSPs). This, in turn, reduces H2O2 production, thus delaying secondary wall deposition and leading to finer fibers. Our findings reveal how alterations in linoleic acid influence cellulose synthesis and suggest a potential strategy to improve cotton fiber quality by regulating lipid metabolism pathways.

Keywords: GhROD1; Gossypium hirsutum L.; H2O2; cellulose synthesis; cotton fiber development; linoleic acid; phosphatidylcholine diacylglycerol cholinephosphotransferase (PDCT); small heat shock proteins.


Conflict of interest statement

The authors declare no conflicts of interest.

Figures

Figure 1
Figure 1
Expression of GhROD1 in cotton plants. (A) Expression levels of GhROD1 in various tissues. Total RNA was extracted from roots, stems, leaves, ovules at 20 DPA, and fibers, petals, sepals, bracts, and stamens at 20 DPA. GhHis3 was used as an internal control. The results are presented as mean ± SD (n = 3). (B) Expression levels of GhROD1 at different stages of fiber development. Total RNA was extracted from fibers at 6, 8, 10, 12, 14, 16, 18, 20, 22, and 25 DPA. The results are presented as mean ± SD (n = 3), with the x-axis indicating DPA.
Figure 2
Figure 2
Targeted lipidomics analyses of PC, PE, and DAG in cotton fibers at the transition stage (20 DPA). (A) Total fatty acid composition in fibers of wild-type and transgenic cotton. C16:0: palmitic acid; C18:0: stearic acid; C18:1: oleic acid; C18:2: linoleic acid; and C18:3: linolenic acid. Data are presented as mean ± SD (n = 3). Data were analyzed by one-way ANOVA followed by Tukey’s test. Different lowercase letters indicate significant differences among groups. (BD) Relative PC, PE, and DAG species content in the fibers at 20 DPA of wild-type and transgenic cotton. WT: wild-type (Gossypium hirsutum L. cv. Jimian14). Ri3 and Ri4: GhROD1-downregulated lines. OE17 and OE25: GhROD1-upregulated lines. PC: phosphatidylcholine. PE: phosphatidylethanolamine. DAG: diacylglycerol. Data for each molecular species represent the means and SDs of five independent extractions and are presented as mol% of total glycerophospholipids. Differences between transgenic lines and wild-type were analyzed by one-way ANOVA followed by Tukey’s test. Different lowercase letters indicate significant differences among groups. Components with lipid molecular species below 1% are not shown in the figure.
Figure 3
Figure 3
Cross-section of mature fibers in wild-type and GhROD1 transgenic cotton. (AE) Cross-section of mature fibers in wild-type cv. Jimian14, Ri3, Ri4, OE17, and OE25. (F) Statistics of cell wall thickness of mature fibers in wild-type and transgenic cotton (n ≥ 150). Statistical data analysis was performed by one-way ANOVA followed by Tukey’s test. Different lowercase letters indicate significant differences among groups.
Figure 4
Figure 4
Transcriptome analysis of GhROD1-downregulated RNAi (Ri3) fibers at 16 DPA. (A) Volcano plot illustrating the differentially expressed genes (DEGs) between wild-type and Ri3 plants. In this plot, red and blue dots denote the DEGs between WT and Ri3. Red dots indicate genes that are significantly upregulated compared to WT, blue dots indicate genes that are significantly downregulated, and gray dots represent genes exhibiting no significant differential expression. (B,C) GO, KEGG enrichment analysis of DEGs between wild-type and Ri3 (bubble plot). The size of the dots represents the number of genes/transcripts associated with each GO term, showing the top 20 enrichment results. DEGs were defined by a fold change ≥ 2 and an adjusted p-value < 0.05.
Figure 5
Figure 5
The expression profiles of sHSPs and GhCesAs. (A,B) Relative expression levels of sHSPs and GhCesAs in wild-type and transgenic cotton. Differences between transgenic lines and wild-type were analyzed by one-way ANOVA followed by Tukey’s test. Different lowercase letters indicate significant differences among groups. (C) Relative expression levels of sHSPs in ovules treated with 100 μM DTT. GhHis3 was used as an internal control. (D) Relative expression levels of sHSPs and GhCesAs in fibers treated with 5 μM linoleic acid (C18:2). CK: without linoleic acid (C18:2). Results are shown as mean ± SD (n = 3). Differences between the control and treatment were analyzed using Student’s t-test (* p < 0.05; ** p < 0.01) for (C,D).
Figure 6
Figure 6
Analysis of H2O2 levels in various materials and treatments. (A) H2O2 content in tobacco leaves after transient expression of GhHSP17.6B, GhHSP17.9F, and GhHSP18.4. The empty vector (VC) served as a control. Values are the mean of three replicates, and vertical bars indicate ± SD (n = 3). (B) H2O2 content in wild-type and transgenic cotton fibers at 14 DPA and 16 DPA. Data were analyzed by one-way ANOVA followed by Tukey’s test. Different lowercase letters indicate significant differences among groups. (C) H2O2 content in siliques of wild-type Arabidopsis and rod1 mutant at 9 DPA. WT: wild-type Arabidopsis Col-0; rod1: loss-of-function rod1 mutant. Data are presented as mean ± SD (n = 3). (D,E) H2O2 content in cotton fibers treated with linoleic acid and DPI, respectively. CK: without linoleic acid or DPI as control; 0.5 μM, 5 μM, and 50 μM C18:2: supplemented with the corresponding concentration of linoleic acid in the medium. Data are presented as mean ± SD (n = 3). (F) Expression profiles of GhCesA4B, GhCesA7B, and GhCesA8B in fibers treated with DPI. CK: BT medium without DPI as control. Data are presented as mean ± SD (n = 3). Differences between the control and treatment were analyzed using Student’s t-test for (A,CF). “*” indicates a significant difference (p < 0.05), and “**” indicates a highly significant difference (p < 0.01).
Figure 7
Figure 7
Proposed working model of GhROD1-mediated diacylglycerol (DAG)-to-phosphatidylcholine (PC) interconversion in cotton fiber. Downregulation of GhROD1 can reduce the rate of DAG-to-PC interconversion, leading to the accumulation of C18:2 in acyl pool of ER, which upregulates the expression of small heat shock proteins (sHSPs). The elevated sHSPs inhibit the production of H2O2, which reduces the secondary wall synthesis, resulting in finer fibers.

Similar articles

Cited by

References

    1. Jung J., Maeda M., Chang A., Landivar J., Yeom J., McGinty J. Unmanned aerial system assisted framework for the selection of high yielding cotton genotypes. Comput. Electron. Agric. 2018;152:74–81. doi: 10.1016/j.compag.2018.06.051. - DOI
    1. Khan M.A., Wahid A., Ahmad M., Tahir M.T., Ahmed M., Ahmad S., Hasanuzzaman M. World cotton production and consumption: An overview. In: Ahmad S., Hasanuzzaman M., editors. Cotton Production and Uses: Agronomy, Crop Protection, and Postharvest Technologies. Springer; Singapore: 2020. pp. 1–7.
    1. Kim H.J., Triplett B.A. Cotton fiber growth in planta and in vitro models for plant cell elongation and cell wall biogenesis. Plant Physiol. 2001;127:1361–1366. doi: 10.1104/pp.010724. - DOI - PMC - PubMed
    1. Haigler C.H., Betancur L., Stiff M.R., Tuttle J.R. Cotton fiber: A powerful single-cell model for cell wall and cellulose research. Front. Plant Sci. 2012;3:104. doi: 10.3389/fpls.2012.00104. - DOI - PMC - PubMed
    1. Ohlrogge J., Browse J., Jaworski J., Somerville C. Lipids. In: Buchanan B.B., Gruissem W., Jones R.L., editors. Biochemistry and Molecular Biology of Plants. Wiley; Oxford, UK: 2015. pp. 337–344.

MeSH terms

LinkOut - more resources