

Dietary Regulation of Lipid Metabolism in Gestational Diabetes Mellitus: Implications for Fetal Macrosomia
- PMID: 39457029
- PMCID: PMC11508696
- DOI: 10.3390/ijms252011248
Dietary Regulation of Lipid Metabolism in Gestational Diabetes Mellitus: Implications for Fetal Macrosomia
Abstract
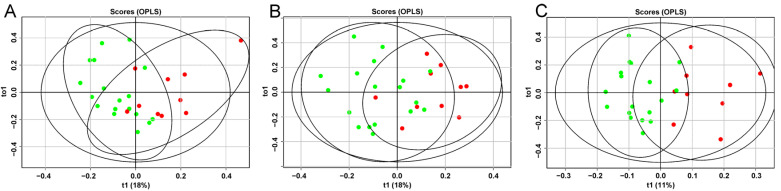
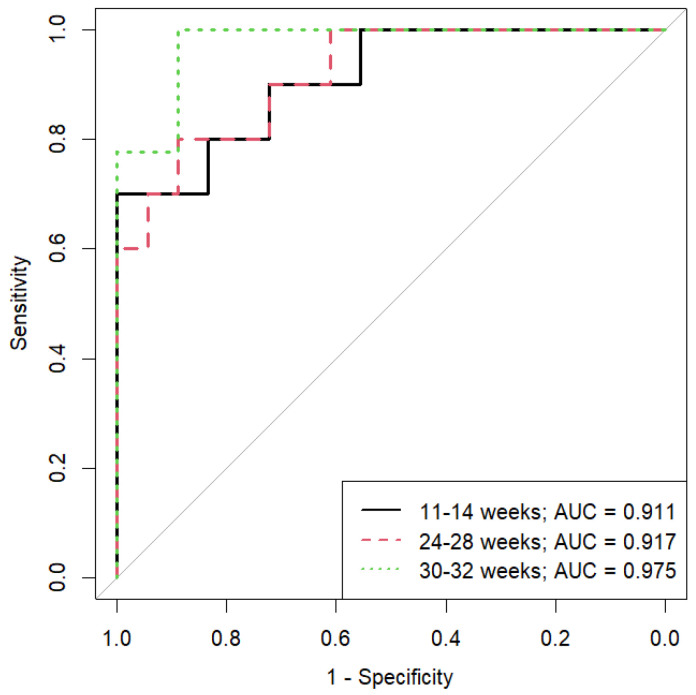
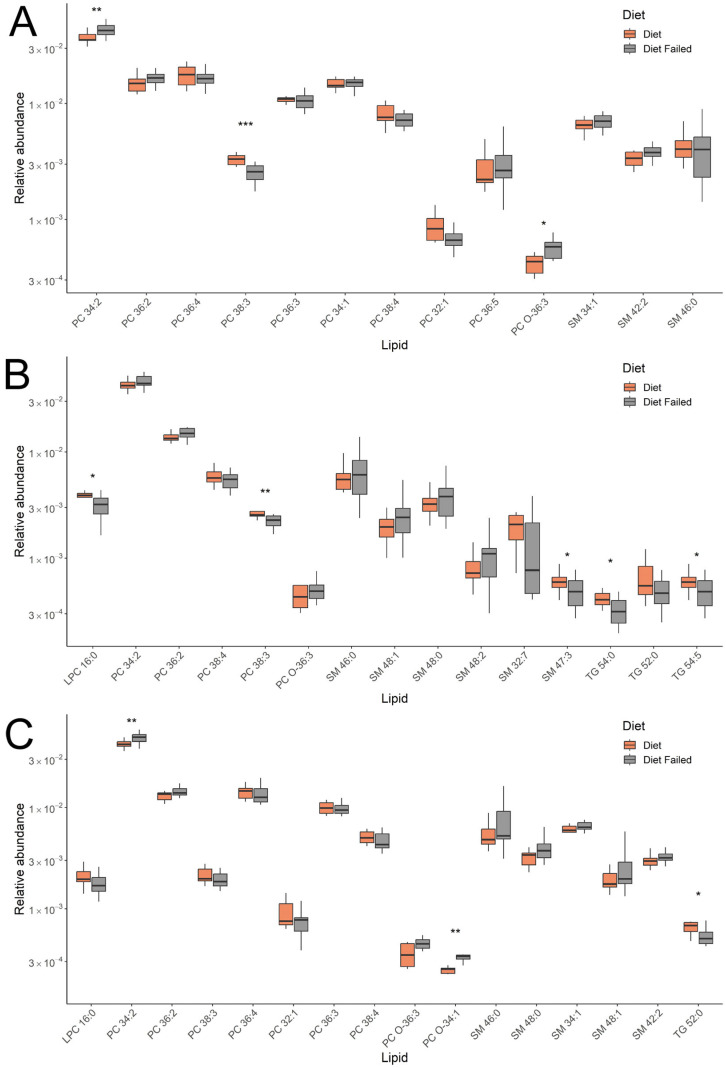
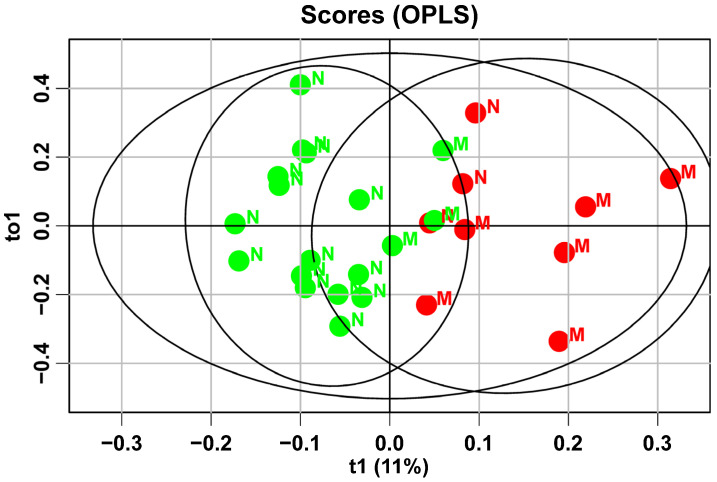
The primary therapeutic approach for managing hyperglycemia today is diet therapy. Lipids are not only a source of nutrients but also play a role in initiating adipocyte differentiation in the fetus, which may explain the development of fetal macrosomia and future metabolic disorders in children born to mothers with gestational diabetes mellitus (GDM). Alterations in the maternal blood lipid profile, influenced by adherence to a healthy diet in mothers with GDM and the occurrence of fetal macrosomia, represent a complex and not fully understood process. The aim of this study was to examine the characteristics of the blood plasma lipid profile in pregnant women with GDM across all trimesters based on adherence to diet therapy. The clinical part of the study followed a case-control design, including 110 women: 80 in the control group, 20 in a GDM group adhering to the diet, and 10 in a GDM group not adhering to the diet. The laboratory part was conducted as a longitudinal dynamic study, with venous blood samples collected at three time points: 11-13, 24-26, and 30-32 weeks of pregnancy. A significant impact of diet therapy on the composition of blood lipids throughout pregnancy was demonstrated, starting as early as the first trimester. ROC analysis indicated high effectiveness of the models developed, with an AUC of 0.98 for the 30- to 32-week model and sensitivity and specificity values of 1 and 0.9, respectively. An association was found between dietary habits, maternal blood lipid composition at 32 weeks, and newborn weight. The changes in lipid profiles during macrosomia development and under diet therapy were found to be diametrically opposed, confirming at the molecular level that diet therapy can normalize not only carbohydrate metabolism but also lipid metabolism in both the mother and fetus. Based on the data obtained, it is suggested that after further validation, the developed models could be used to improve the prognosis of macrosomia by analyzing blood plasma lipid profiles at various stages of pregnancy.
Keywords: diet therapy; gestational diabetes mellitus; lipidome; macrosomia; mass spectrometry; obesity.
Conflict of interest statement
The authors declare no conflicts of interest.
Figures
Similar articles
-
Early Prediction of Fetal Macrosomia Through Maternal Lipid Profiles.Int J Mol Sci. 2025 Jan 28;26(3):1149. doi: 10.3390/ijms26031149. Int J Mol Sci. 2025. PMID: 39940917 Free PMC article.
-
Associations between maternal lipid profile and pregnancy complications and perinatal outcomes: a population-based study from China.BMC Pregnancy Childbirth. 2016 Mar 21;16:60. doi: 10.1186/s12884-016-0852-9. BMC Pregnancy Childbirth. 2016. PMID: 27000102 Free PMC article.
-
Prediction of neonates' macrosomia with maternal lipid profile of healthy mothers.Pediatr Neonatol. 2014 Feb;55(1):28-34. doi: 10.1016/j.pedneo.2013.05.006. Epub 2013 Aug 2. Pediatr Neonatol. 2014. PMID: 23911877
-
Implications of Lipids in Neonatal Body Weight and Fat Mass in Gestational Diabetic Mothers and Non-Diabetic Controls.Curr Diab Rep. 2018 Feb 5;18(2):7. doi: 10.1007/s11892-018-0978-4. Curr Diab Rep. 2018. PMID: 29399727 Review.
-
[Nutrients other than glucose might explain fetal overgrowth in gestational diabetic pregnancies].Rev Med Chil. 2013 Nov;141(11):1441-8. doi: 10.4067/S0034-98872013001100011. Rev Med Chil. 2013. PMID: 24718471 Review. Spanish.
Cited by
-
Human milk composition in women with gestational diabetes mellitus: a systematic review and meta-analysis.BMC Pregnancy Childbirth. 2025 May 9;25(1):549. doi: 10.1186/s12884-025-07412-7. BMC Pregnancy Childbirth. 2025. PMID: 40346463 Free PMC article.
References
-
- International Diabetes Federation . In: IDF Diabetes Atlas. 9th ed. Karuranga S., Maland B., Saeedi P., Salpea P., editors. International Diabetes Federation; Brussels, Belgium: 2019.
-
- Abbafati C., Abbas K.M., Abbasi-Kangevari M., Abd-Allah F., Abdelalim A., Abdollahi M., Abdollahpour I., Abegaz K.H., Abolhassani H., Aboyans V., et al. Global burden of 87 risk factors in 204 countries and territories, 1990–2019: A systematic analysis for the Global Burden of Disease Study 2019. Lancet. 2020;396:1223–1249. doi: 10.1016/S0140-6736(20)30752-2. - DOI - PMC - PubMed
-
- Dedov I.I., Krasnopol’skiy V.I., Sukhikh G.T. Russian National Consensus Statement on gestational diabetes: Diagnostics, treatment and postnatal care. Diabetes Mellit. 2012;15:4–10. doi: 10.14341/2072-0351-5531. - DOI
MeSH terms
Substances
Grants and funding
LinkOut - more resources
Full Text Sources
