. 2024 Oct 20;25(20):11277.
doi: 10.3390/ijms252011277.

AdipoRon Alleviates Liver Injury by Protecting Hepatocytes from Mitochondrial Damage Caused by Ionizing Radiation

Affiliations

AdipoRon Alleviates Liver Injury by Protecting Hepatocytes from Mitochondrial Damage Caused by Ionizing Radiation

Yi Liu et al. Int J Mol Sci. .

Abstract

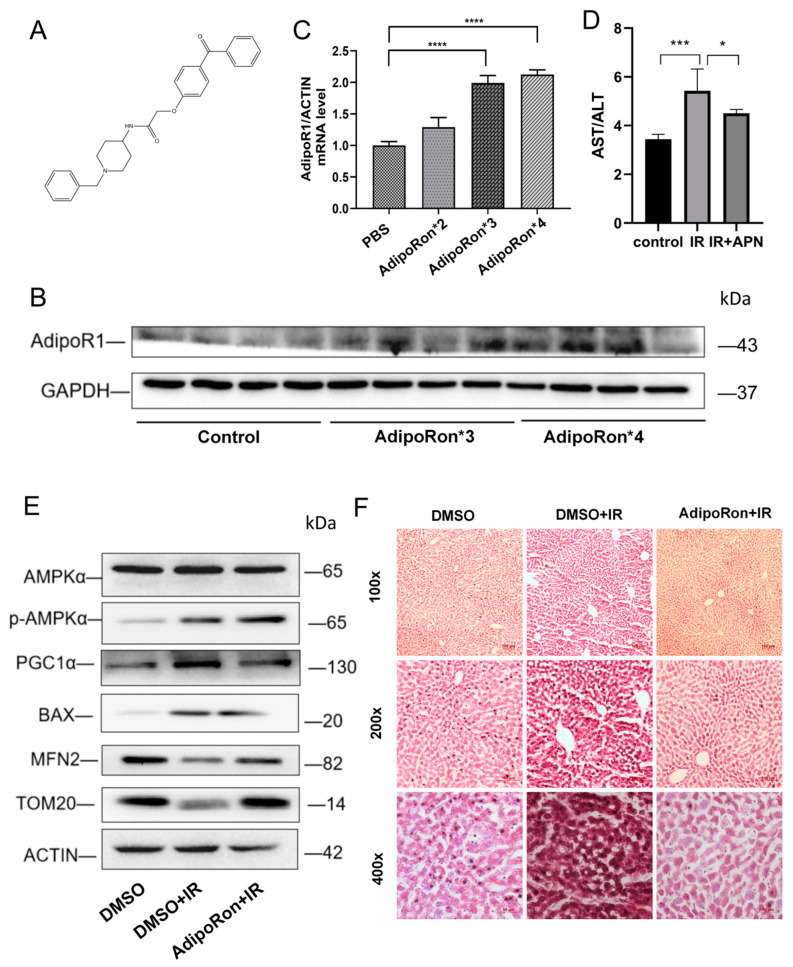
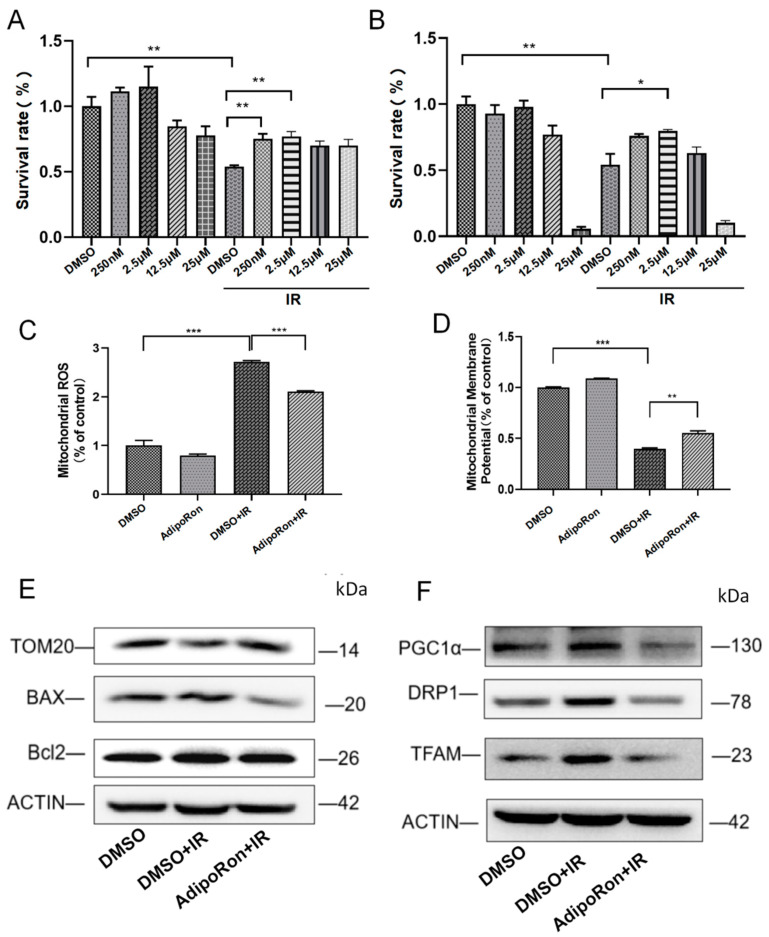
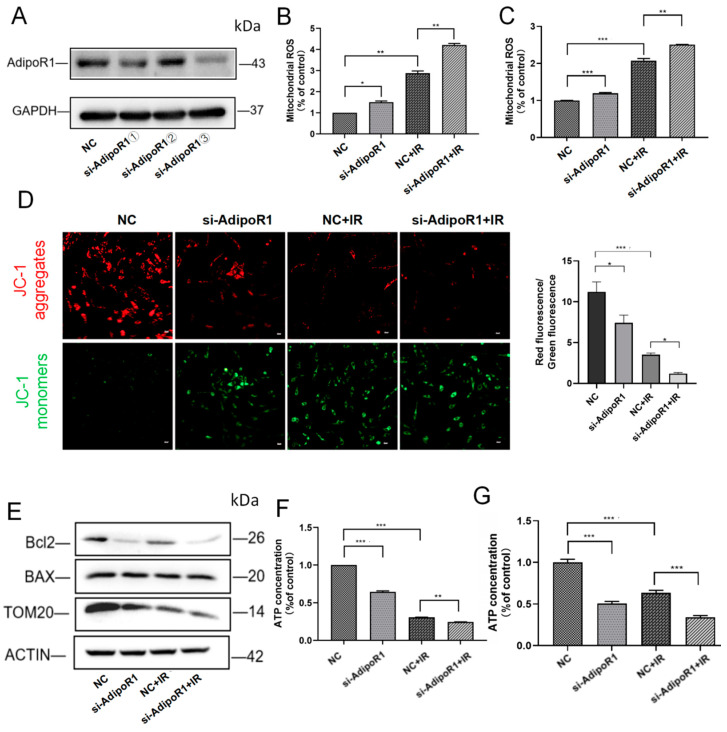
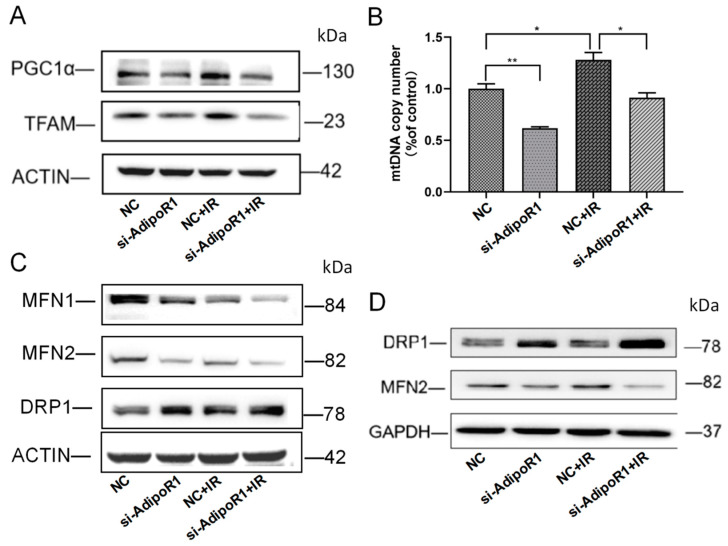
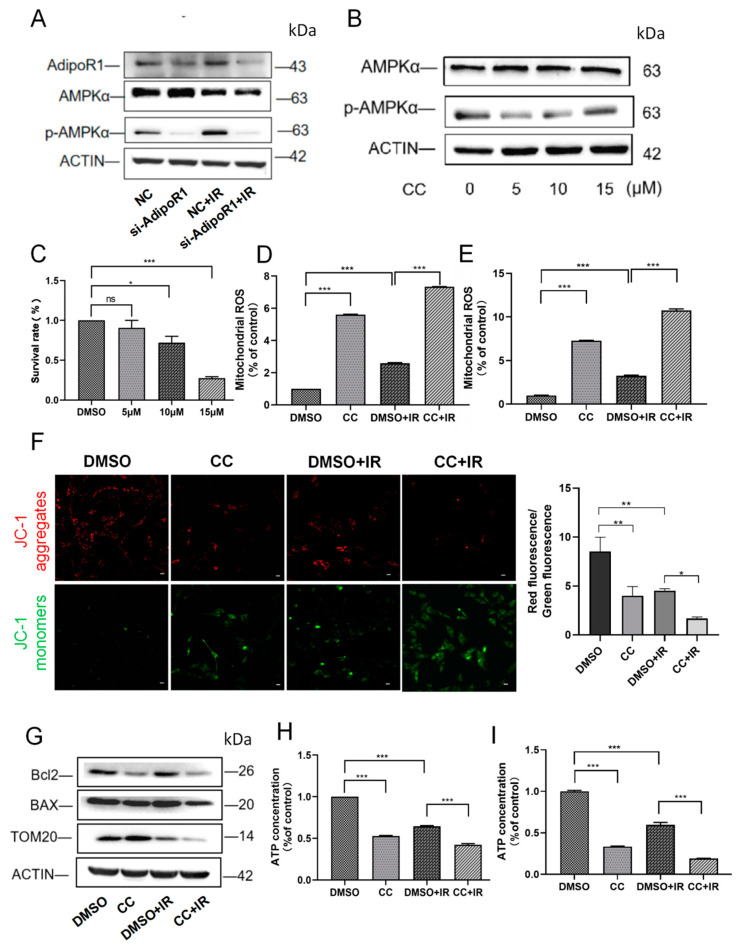
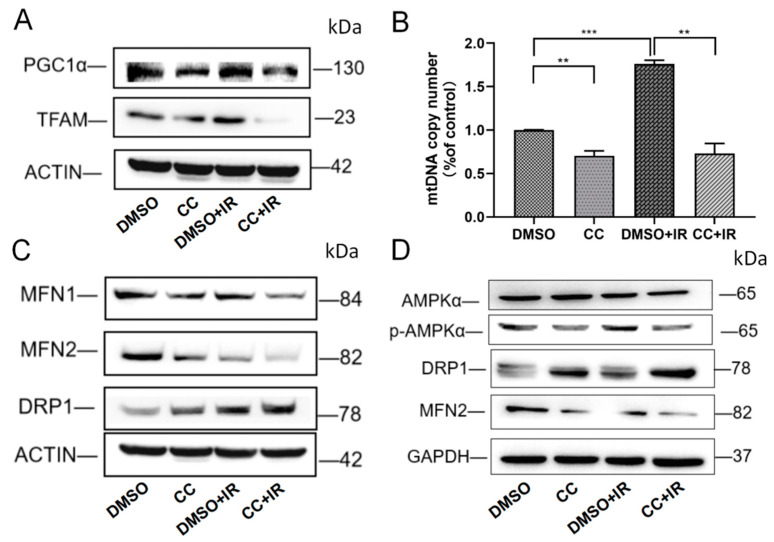
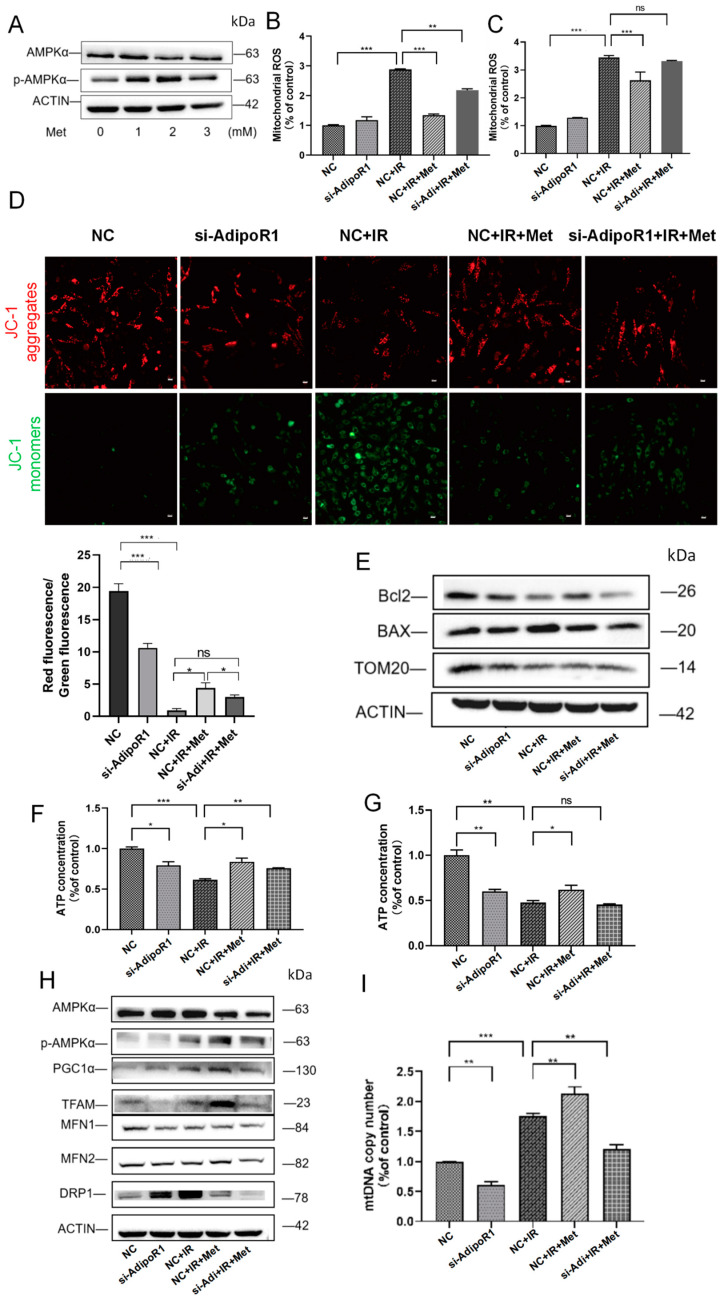
Radiation liver injury is a common complication of hepatocellular carcinoma radiotherapy. It is mainly caused by irreversible damage to the DNA of hepatocellular cells directly by radiation, which seriously interferes with metabolism and causes cell death. AdipoRon can maintain lipid metabolism and stabilize blood sugar by activating adiponectin receptor 1 (AdipoR1). However, the role of AdipoRon/AdipoR1 in the regulation of ionizing radiation (IR)-induced mitochondrial damage remains unclear. In this study, we aimed to elucidate the roles of AdipoRon/AdipoR1 in IR-induced mitochondrial damage in normal hepatocyte cells. We found that AdipoRon treatment rescued IR-induced liver damage in mice and mitochondrial damage in normal hepatocytes in vivo and in vitro. AdipoR1 deficiency exacerbated IR-induced oxidative stress, mitochondrial dynamics, and biogenesis disorder. Mechanistically, the absence of AdipoR1 inhibits the activity of adenosine monophosphate-activated protein kinase α (AMPKα), subsequently leading to disrupted mitochondrial dynamics by decreasing mitofusin (MFN) and increasing dynamin-related protein 1 (DRP1) protein expression. It also controls mitochondrial biogenesis by suppressing the peroxisome proliferator-activated receptor-gamma coactivator-1 alpha (PGC1α) and transcription factor A (TFAM) signaling pathway, ultimately resulting in impaired mitochondrial function. To sum up, AdipoRon/AdipoR1 maintain mitochondrial function by regulating mitochondrial dynamics and biogenesis through the AdipoR1-AMPKα signaling pathway. This study reveals the significant role of AdipoR1 in regulating IR-induced mitochondrial damage in hepatocytes and offers a novel approach to protecting against damage caused by IR.

Keywords: AMPKα; AdipoR1; AdipoRon; ionizing radiation; liver injury; mitochondrial damage; radiation protection.


Conflict of interest statement

The authors declare no conflicts of interest.

Figures

Figure 1
Figure 1
AdipoRon reversed IR-induced mouse liver injury. (A) Chemical structure of AdipoRon. (B) Protein expression of AdipoR1 in mice liver after different doses of tail vein injection of AdipoRon. (C) mRNA expression of AdipoR1 in mice liver after different doses of tail vein injection of AdipoRon. (D) The ratio of ALT and AST in the blood of mice in different treatment groups. (E) Western blot analysis of AMPKα, p-AMPKα, TOM20, MFN2, PGC1α, and BAX expression levels in different groups. (F) H&E staining of mice livers in different groups. Data represent the mean ± SEM (n = 3 independent repeats); p values were calculated using one-way ANOVA. * p < 0.05, *** p < 0.001 and **** p < 0.0001.
Figure 2
Figure 2
AdipoRon reversed IR-induced mitochondrial damage. (A) HHL-5 cells were pretreated with different concentrations of AdipoRon. Cell viability was detected by the CCK-8 kit. (B) LO-2 cells were pretreated with different concentrations of AdipoRon. The cell viability was detected by the CCK-8 kit. (C) Mitochondrial reactive oxygen species levels were analyzed by the mitoSOX kit in HHL-5 cells. (D) Mitochondrial membrane potential levels were analyzed by DIOC6 staining in HHL-5 cells. (E) Western blot analysis of TOM20, Bcl2, and BAX expression levels in HHL-5 cells. (F) Western blotting was used to analyze the changes in PGC1α, TFAM, and DRP1. Data represent the mean ± SEM (n = 3 independent repeats); p values were calculated using one-way ANOVA. * p < 0.05, ** p < 0.01, and *** p < 0.001.
Figure 3
Figure 3
AdipoR1 knockdown exacerbated mitochondrial function damage after IR. (A) Western blot analysis of AdipoR1 levels in HHL-5 cells following AdipoR1 knockdown treatment. (B) Mitochondrial ROS levels in HHL-5 cells were analyzed using the mitoSOX kit. (C) Mitochondrial ROS levels in LO-2 cells were analyzed using the mitoSOX kit. (D) After treatment, the cells were subjected to JC-1 staining for mitochondrial membrane potential assessment. Red staining indicates polarized mitochondria in JC-1 staining. Green staining indicates depolarized mitochondria in JC-1 staining. Scale bar: 500 μm. (E) Expression of the proteins TOM20, Bcl2, and BAX in HHL-5 cells was demonstrated by Western blot analysis. (F) ATP content in different groups of HHL-5 cells. (G) ATP content in different groups of LO-2 cells. Data represent the mean ± SEM (n = 3 independent repeats). p Values were calculated using one-way ANOVA. * p < 0.05, ** p < 0.01, and *** p < 0.001.
Figure 4
Figure 4
AdipoR1 knockdown exacerbated mitochondrial biogenesis and disrupted mitochondrial dynamics after IR. (A) Western blotting was used to analyze the changes in PGC1α and TFAM in HHL-5 cells. (B) Relative mtDNA copy number in HHL-5 cells. (C) The expressions of MFN1, MFN2, and DRP1 in HHL-5 cells were detected using Western blot analysis. (D) The expressions of MFN2 and DRP1 in LO-2 cells were detected using Western blot analysis. Data represent the mean ± SEM (n = 3 independent repeats). p Values were calculated using one-way ANOVA. * p < 0.05, ** p < 0.01.
Figure 5
Figure 5
Inhibiting p-AMPKα led to more severe mitochondrial damage following IR treatment. (A) Western blot analysis of AMPKα and p-AMPKα levels in HHL-5 cells following AdipoR1 knockdown. (B) Western blot analysis was conducted to assess the levels of AMPKα and p-AMPKα in HHL-5 cells after treatment with CC. (C) HHL-5 cells were pretreated with various concentrations of Compound C. Cell viability was assessed using the CCK-8 kit. (D) Mitochondrial reactive oxygen species levels in HHL-5 cells were analyzed using the mitoSOX kit. (E) Mitochondrial reactive oxygen species levels in LO-2 cells were analyzed using the mitoSOX kit. (F) After treatment, the HHL-5 cells were subjected to JC-1 staining to assess mitochondrial membrane potential. Red staining indicates polarized mitochondria in JC-1 staining. Green staining indicates depolarized mitochondria in JC-1 staining. Scale bar: 500 μm. (G) The expression of the proteins TOM20, Bcl2, and BAX in HHL-5 cells was demonstrated by Western blot analysis. (H) ATP content in different groups of HHL-5 cells. (I) ATP content in different groups of LO-2 cells. Data represent the mean ± SEM (n = 3 independent repeats). p Values were calculated using one-way ANOVA. * p < 0.05, ** p < 0.01, and *** p < 0.001.
Figure 6
Figure 6
Inhibition of p-AMPKα activity exacerbated mitochondrial biogenesis and mitochondrial dynamic imbalance after IR. (A) Western blotting was used to analyze the changes in PGC1α and TFAM in HHL-5 cells. (B) Relative mtDNA copy number in HHL-5 cells. (C) The expression of the proteins MFN1, MFN2, and DRP1 was detected by Western blotting in HHL-5 cells. (D) The expression of the proteins AMPKα, p-AMPKα, MFN2, and DRP1 was detected using Western blot analysis in LO-2 cells. Data represent the mean ± SEM (n = 3 independent repeats). p Values were calculated using one-way ANOVA. ** p < 0.01, and *** p < 0.001.
Figure 7
Figure 7
Activating p-AMPKα alleviated the damage to mitochondrial function following AdipoR1 knockdown combined with IR. (A) Western blot analysis of AMPKα and p-AMPKα levels in HHL-5 cells following Metformin treatment. (B) Mitochondrial reactive oxygen species levels were analyzed in HHL-5 cells using the mitoSOX kit. (C) Mitochondrial reactive oxygen species levels were analyzed in LO-2 cells using the mitoSOX kit. (D) After treatment, the cells were subjected to JC-1 staining to assess mitochondrial membrane potential. Red staining indicates polarized mitochondria in JC-1 staining. Green staining indicates depolarized mitochondria in JC-1 staining. Scale bar: 500 μm. (E) The expression of the proteins TOM20, Bcl2, and BAX in HHL-5 cells was demonstrated by Western blot analysis. (F) ATP content in different groups of HHL-5 cells. (G) ATP content in different groups of LO-2 cells. (H) The expression of the proteins AMPKα, p-AMPKα, PGC1α, TFAM, MFN1, MFN2, and DRP1 in HHL-5 cells was detected using Western blot analysis. (I) Relative mtDNA copy number in HHL-5 cells. Data represent the mean ± SEM (n = 3 independent repeats). p Values were calculated using one-way ANOVA. * p < 0.05, ** p < 0.01, and *** p < 0.001.

Similar articles

Cited by

  • AdipoRon's Impact on Alzheimer's Disease-A Systematic Review and Meta-Analysis.
    Barbalho SM, Laurindo LF, de Oliveira Zanuso B, da Silva RMS, Gallerani Caglioni L, Nunes Junqueira de Moraes VBF, Fornari Laurindo L, Dogani Rodrigues V, da Silva Camarinha Oliveira J, Beluce ME, Penteado Detregiachi CR, Barbalho Lamas C, Dos Santos Haber JF, Cavallari Strozze Catharin VM, Quesada K, Tanaka M, Valenti VE. Barbalho SM, et al. Int J Mol Sci. 2025 Jan 8;26(2):484. doi: 10.3390/ijms26020484. Int J Mol Sci. 2025. PMID: 39859201 Free PMC article.

References

    1. Annesley S.J., Fisher P.R. Mitochondria in Health and Disease. Cells. 2019;8:680. doi: 10.3390/cells8070680. - DOI - PMC - PubMed
    1. Nunnari J., Suomalainen A. Mitochondria: In sickness and in health. Cell. 2012;148:1145–1159. doi: 10.1016/j.cell.2012.02.035. - DOI - PMC - PubMed
    1. Manoli I., Alesci S., Blackman M.R., Su Y.A., Rennert O.M., Chrousos G.P. Mitochondria as key components of the stress response. Trends Endocrinol. Metab. 2007;18:190–198. doi: 10.1016/j.tem.2007.04.004. - DOI - PubMed
    1. Zhou H., Hong M., Chai Y., Hei T.K. Consequences of cytoplasmic irradiation: Studies from microbeam. J. Radiat. Res. 2009;50:A59–A65. doi: 10.1269/jrr.08120S. - DOI - PMC - PubMed
    1. Narayanan P.K., Goodwin E.H., Lehnert B.E. Alpha particles initiate biological production of superoxide anions and hydrogen peroxide in human cells. Cancer Res. 1997;57:3963–3971. - PubMed

MeSH terms

LinkOut - more resources