

Extremely Low-Frequency Electromagnetic Field (ELF-EMF) Increases Mitochondrial Electron Transport Chain Activities and Ameliorates Depressive Behaviors in Mice
- PMID: 39457098
- PMCID: PMC11508854
- DOI: 10.3390/ijms252011315
Extremely Low-Frequency Electromagnetic Field (ELF-EMF) Increases Mitochondrial Electron Transport Chain Activities and Ameliorates Depressive Behaviors in Mice
Abstract
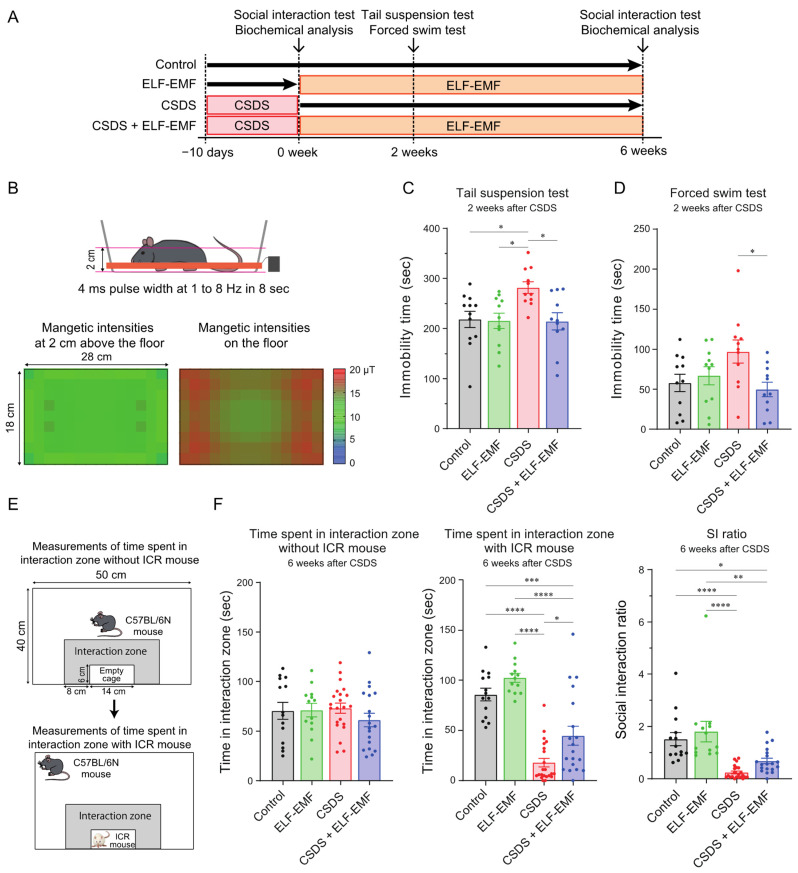
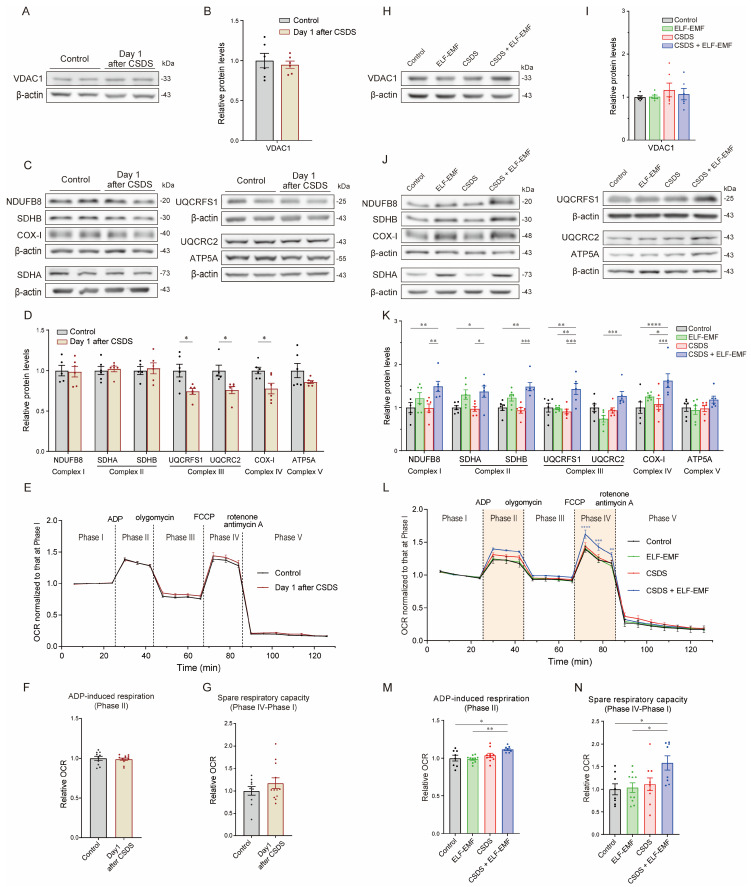
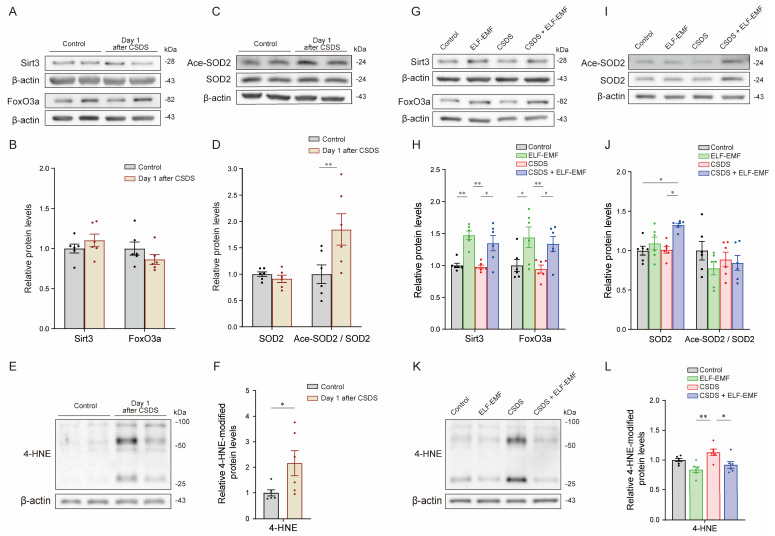
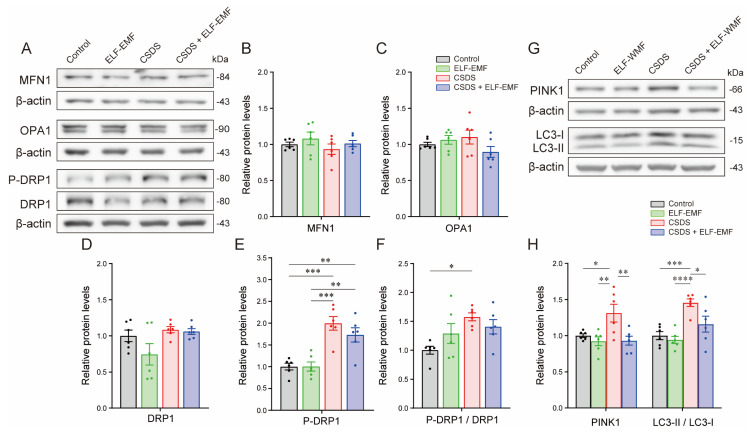
Compromised mitochondrial electron transport chain (ETC) activities are associated with depression in humans and rodents. However, the effects of the enhancement of mitochondrial ETC activities on depression remain elusive. We recently reported that an extremely low-frequency electromagnetic field (ELF-EMF) of as low as 10 μT induced hormetic activation of mitochondrial ETC complexes in human/mouse cultured cells and mouse livers. Chronic social defeat stress (CSDS) for 10 consecutive days caused behavioral defects mimicking depression in mice, and using an ELF-EMF for two to six weeks ameliorated them. CSDS variably decreased the mitochondrial ETC proteins in the prefrontal cortex (PFC) in 10 days, which were increased by an ELF-EMF in six weeks. CSDS had no effect on the mitochondrial oxygen consumption rate in the PFC in 10 days, but using an ELF-EMF for six weeks enhanced it. CSDS inactivated SOD2 by enhancing its acetylation and increased lipid peroxidation in the PFC. In contrast, the ELF-EMF activated the Sirt3-FoxO3a-SOD2 pathway and suppressed lipid peroxidation. Furthermore, CSDS increased markers for mitophagy, which was suppressed by the ELF-EMF in six weeks. The ELF-EMF exerted beneficial hormetic effects on mitochondrial energy production, mitochondrial antioxidation, and mitochondrial dynamics in a mouse model of depression. We envisage that an ELF-EMF is a promising therapeutic option for depression.
Keywords: extremely low-frequency electromagnetic field (ELF-EMF); major depressive disorder; mitochondrial electron transport chain; oxidative stress; social defeat stress.
Conflict of interest statement
The authors declare no conflicts of interest.
Figures
Similar articles
-
Extremely low-frequency electromagnetic field (ELF-EMF) enhances mitochondrial energy production in NARP cybrids.Sci Rep. 2025 Jul 8;15(1):24369. doi: 10.1038/s41598-025-10536-7. Sci Rep. 2025. PMID: 40629055 Free PMC article.
-
The preventive effect of lotus seedpod procyanidins on cognitive impairment and oxidative damage induced by extremely low frequency electromagnetic field exposure.Food Funct. 2013 Aug;4(8):1252-62. doi: 10.1039/c3fo60116a. Food Funct. 2013. PMID: 23764910
-
Neuroprotective effects of lotus seedpod procyanidins on extremely low frequency electromagnetic field-induced neurotoxicity in primary cultured hippocampal neurons.Biomed Pharmacother. 2016 Aug;82:628-39. doi: 10.1016/j.biopha.2016.05.032. Epub 2016 Jun 13. Biomed Pharmacother. 2016. PMID: 27470406
-
A review on the effects of extremely low frequency electromagnetic field (ELF-EMF) on cytokines of innate and adaptive immunity.Electromagn Biol Med. 2019;38(1):84-95. doi: 10.1080/15368378.2018.1545668. Epub 2018 Dec 6. Electromagn Biol Med. 2019. PMID: 30518268 Review.
-
Role of Mitochondria in the Oxidative Stress Induced by Electromagnetic Fields: Focus on Reproductive Systems.Oxid Med Cell Longev. 2018 Nov 8;2018:5076271. doi: 10.1155/2018/5076271. eCollection 2018. Oxid Med Cell Longev. 2018. PMID: 30533171 Free PMC article. Review.
Cited by
-
Effects of Extremely Low-Frequency Electromagnetic Field Treatment on ASD Symptoms in Children: A Pilot Study.Brain Sci. 2024 Dec 22;14(12):1293. doi: 10.3390/brainsci14121293. Brain Sci. 2024. PMID: 39766492 Free PMC article.
-
Molecular Links Between Metabolism and Mental Health: Integrative Pathways from GDF15-Mediated Stress Signaling to Brain Energy Homeostasis.Int J Mol Sci. 2025 Aug 6;26(15):7611. doi: 10.3390/ijms26157611. Int J Mol Sci. 2025. PMID: 40806735 Free PMC article. Review.
-
Lactiplantibacillus plantarum FRT4 protects against fatty liver hemorrhage syndrome: regulating gut microbiota and FoxO/TLR-4/NF-κB signaling pathway in laying hens.Microbiome. 2025 Mar 29;13(1):88. doi: 10.1186/s40168-025-02083-0. Microbiome. 2025. PMID: 40158133 Free PMC article.
-
Extremely low-frequency electromagnetic field (ELF-EMF) enhances mitochondrial energy production in NARP cybrids.Sci Rep. 2025 Jul 8;15(1):24369. doi: 10.1038/s41598-025-10536-7. Sci Rep. 2025. PMID: 40629055 Free PMC article.
-
Neurostimulation devices to treat Alzheimer's disease.Explor Neurosci. 2025;4:100674. doi: 10.37349/en.2025.100674. Epub 2025 Feb 25. Explor Neurosci. 2025. PMID: 40084342 Free PMC article.
References
MeSH terms
Substances
Grants and funding
- JP23K18273/Japan Society for the Promotion of Science
- JP23K06412/Japan Society for the Promotion of Science
- JP23H02794/Japan Society for the Promotion of Science
- 23FC1014/Ministry of Health, Labour, and Welfare of Japan
- 5-6/Intramural Research Grant for Neurological and Psychiatric Disorders of NCNP
LinkOut - more resources
Full Text Sources
Medical
Research Materials
Miscellaneous
