. 2024 Oct 16;11(10):1248.
doi: 10.3390/children11101248.

Prediction of Whole Liver Graft Weight Based on Biometric Variables in Paediatric and Adult Liver Donors

Affiliations

Prediction of Whole Liver Graft Weight Based on Biometric Variables in Paediatric and Adult Liver Donors

Maria Kuksin et al. Children (Basel). .

Abstract

Background/objectives: In paediatric liver transplantation, donor-recipient compatibility depends on graft size. We explored whether the graft weight can be predicted using the donor's biometric parameters.

Methods: We used seven easily available biometric variables in 142 anonymised paediatric and adult donors, with data collected between 2016 and 2022. The whole or partial liver was transplanted in our hospital from these donors. We identified the variables that had the strongest correlation to our response variable: whole liver graft weight.

Results: In child donors, we determined two linear models: using donor weight and height on the one hand and using donor weight and right liver span on the other hand. Both models had a coefficient of determination R2 = 0.86 and p-value < 10-5. We also determined two models in adult donors using donor weight and height (R2 = 0.33, p < 10-4) and donor weight and sternal height (R2 = 0.38, p < 10-4). The models proved valid based on our external dataset of 245 patients from two institutions.

Conclusions: In clinical practise, our models could provide rapidly accessible estimates to determine whole graft dimension compatibility in liver transplantation in children and adults. Determining similar models predicting the left lobe and lateral segment weight could prove invaluable in paediatric transplantation.

Keywords: linear regression; liver transplantation; model.


Conflict of interest statement

The authors declare no conflicts of interest. The funders had no role in the design of the study; in the collection, analyses, or interpretation of data; in the writing of the manuscript; or in the decision to publish the results.

Figures

Figure 1
Figure 1
The liver weight depends on the donor age. (a) The ratio of liver graft weight to donor weight as a function of the donor age in the training population. (b) The graft weight plotted against the donor age in the training population. The linear regression equation, correlation coefficient, and p-value in donors ≤ 18 are shown in top left corner.
Figure 2
Figure 2
The graft weight evolves similarly with donor weight and donor height in females and males. The linear regressions of total graft weight in females (F) and males (M), plotted against (a,b) the donor height and (c,d) donor weight in (a,c) children and (b,d) in adults. The 95% confidence interval is shown in grey. The number of plotted females (n_f) and males (n_m) are shown in top left.
Figure 3
Figure 3
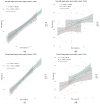
The graft weight can be successfully modelled using linear combinations of the donor weight, height, right liver span, and sternal height. The total graft weight against the optimal linear combinations in (a,b) children and (c,d) adults. The X-axis represents the linear combination shown in the top left corner of each panel. The R2 coefficient of determination and p-value of each model are shown in the top left of the corresponding panel. The sample size (n) is also shown in the top left. The 95% confidence interval is shown in grey.
Figure 4
Figure 4
The established models are valid in the test dataset. The graft weights of the test dataset are plotted as a function of the optimal linear regressions established on the test dataset. The X-axis represents the linear combination shown in the top left corner of each panel. The tested models were those using (a) the donor weight and height in children and (b) in adults. An 80 % prediction interval of the (c) paediatric model and (d) adult model is shown in red dashes. The 95% confidence interval is shown in grey.

References

    1. Peng J.K., Hepgul N., Higginson I.J., Gao W. Symptom prevalence and quality of life of patients with end-stage liver disease: A systematic review and meta-analysis. Palliat. Med. 2019;33:24–36. doi: 10.1177/0269216318807051. - DOI - PMC - PubMed
    1. Rawalm N., Yazigi N. Paediatric Liver Transplantation. Pediat Clin. N. 2017;64:677–684. doi: 10.1016/j.pcl.2017.02.003. - DOI - PubMed
    1. Yang X., Park S., Lee S., Han K., Lee M.R., Song J.S., Yu H.C., Do Yang J. Estimation of right lobe graft weight for living donor liver transplantation using deep learning-based fully automatic computed tomographic volumetry. Sci. Rep. 2023;13:17746. doi: 10.1038/s41598-023-45140-0. - DOI - PMC - PubMed
    1. Vauthey J.N., Abdalla E.K., Doherty D.A., Gertsch P., Fenstermacher M.J., Loyer E.M., Lerut J., Materne R., Wang X., Encarnacion A., et al. Body surface area and body weight predict total liver volume in Western adults. Liver Transpl. 2002;8:233–240. doi: 10.1053/jlts.2002.31654. - DOI - PubMed
    1. Tucker O.N., Heaton N. The ‘small for size’ liver syndrome. Curr. Opin. Crit. Care. 2005;11:150–155. doi: 10.1097/01.ccx.0000157080.11117.45. - DOI - PubMed

LinkOut - more resources