. 2024 Oct 2;15(10):1296.
doi: 10.3390/genes15101296.

Expression of HMGB1, TGF-β1, BIRC3, ADAM17, CDKN1A, and FTO in Relation to Left Ventricular Remodeling in Patients Six Months after the First Myocardial Infarction: A Prospective Study

Affiliations

Expression of HMGB1, TGF-β1, BIRC3, ADAM17, CDKN1A, and FTO in Relation to Left Ventricular Remodeling in Patients Six Months after the First Myocardial Infarction: A Prospective Study

Jovana Kuveljic et al. Genes (Basel). .

Abstract

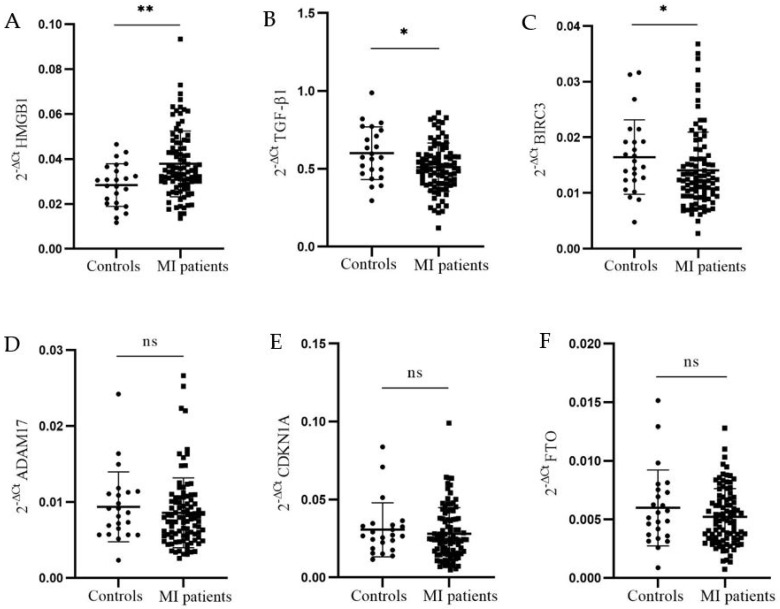
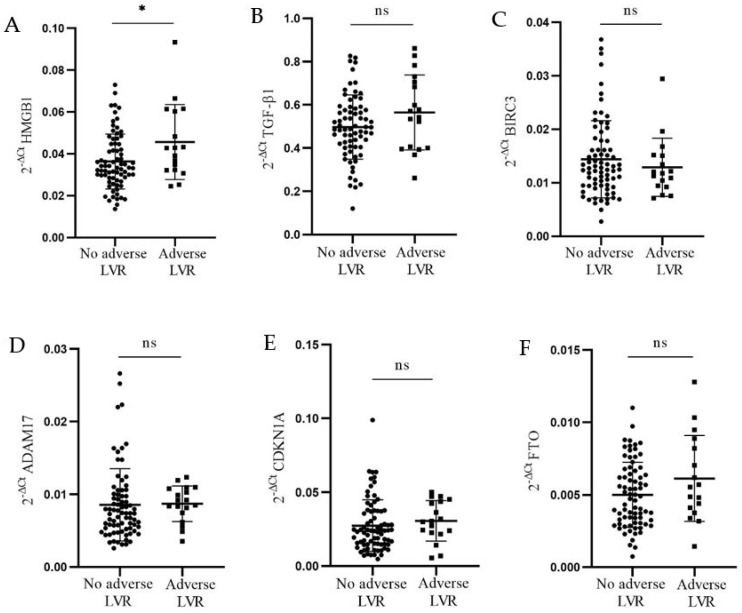
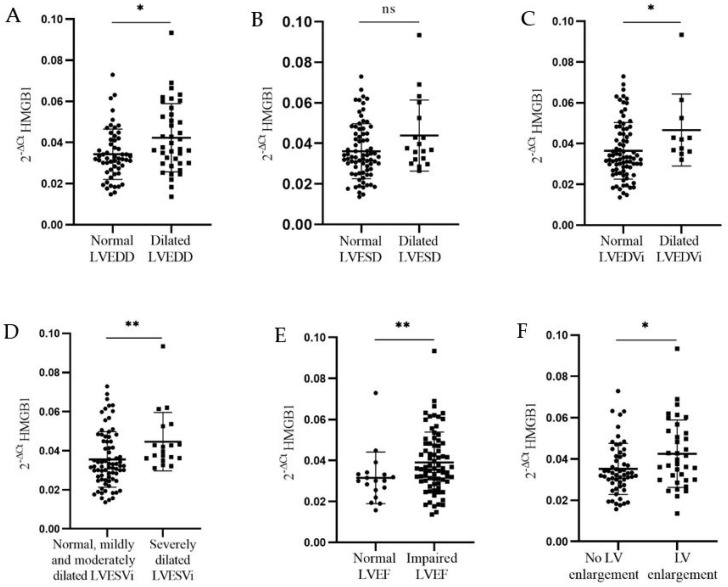
Background: After myocardial infarction (MI), adverse left ventricular (LV) remodeling may occur. This is followed by LV hypertrophy and eventually heart failure. The remodeling process is complex and goes through multiple phases. The aim of this study was to investigate the expression of HMGB1, TGF-β1, BIRC3, ADAM17, CDKN1A, and FTO, each involved in a specific step of LV remodeling, in association with the change in the echocardiographic parameters of LV structure and function used to assess the LV remodeling process in the peripheral blood mononuclear cells (PBMCs) of patients six months after the first MI. The expression of selected genes was also determined in PBMCs of controls. Methods: The study group consisted of 99 MI patients, who were prospectively followed-up for 6 months, and 25 controls. Cardiac parameters, measured via conventional 2D echocardiography, were evaluated at two time points: 3-5 days and 6 months after MI. The mRNA expression six-months-post-MI was detected using TaqMan® technology (Applied Biosystems, Thermo Fisher Scientific, Waltham, MA, USA). Results:HMGB1 mRNA was significantly higher in patients with adverse LV remodeling six-months-post-MI than in patients without adverse LV remodeling (p = 0.04). HMGB1 mRNA was significantly upregulated in patients with dilated LV end-diastolic diameter (LVEDD) (p = 0.03); dilated LV end-diastolic volume index (LVEDVi) (p = 0.03); severely dilated LV end-systolic volume index (LVESVi) (p = 0.006); impaired LV ejection fraction (LVEF) (p = 0.01); and LV enlargement (p = 0.03). It was also significantly upregulated in PBMCs from patients compared to controls (p = 0.005). TGF-β1 and BIRC3 mRNA were significantly lower in patients compared to controls (p = 0.02 and p = 0.05, respectively). Conclusions: Our results suggest that HMGB1 is involved in adverse LV remodeling six-months-post-MI, even on the mRNA level. Further research and validation are needed.

Keywords: ADAM17; BIRC3; CDKN1A; FTO; HMGB1; TGF-β1; gene expression; left ventricular remodeling; mRNA; myocardial infarction.


Conflict of interest statement

The authors declare no conflicts of interest.

Figures

Figure 1
Figure 1
Relative expression of HMGB1, TGF-β1, BIRC3, ADAM17, CDKN1A, and FTO in controls and MI patients’ PBMCs. Relative mRNA expression is presented as 2−∆Ct value for each sample. The cDNAs from the PBMCs if controls (N = 24) and patients with MI (N = 95) were used to quantify gene expression. The difference between the Ct values of the reference gene, Cyclophilin A, and the gene of interest was used to compute the delta Ct value. Data are presented as 2−∆Ct as mean for both groups (controls—circles; patients—squares) ± SD. The difference of mRNAs relative expression between groups was calculated using the Mann–Whitney U test. (A) Significant upregulation of HMGB1 mRNA was detected in PBMCs from patients compared to controls (0.038 ± 0.015 vs. 0.028 ± 0.009, p = 0.005); (B) TGF-β1 mRNA was significantly downregulated in PBMCs from patients compared to controls (0.510 ± 0.155 vs. 0.600 ± 0.168, p = 0.02); (C) BIRC3 mRNA was significantly downregulated in PBMCs from patients compared to controls (0.014 ± 0.007 vs. 0.016 ± 0.007, p = 0.05); (D) ADAM17 mRNA expression was not significantly different between patients and controls (0.009 ± 0.004 vs. 0.009 ± 0.005, p = 0.30); (E) CDKN1A mRNA expression did not differ significantly between patients and controls (0.028 ± 0.017 vs. 0.031 ± 0.017, p = 0.40); (F) there was no significant difference in FTO mRNA expression between patients and controls (0.005 ± 0.002 vs. 0.006 ± 0.003, p = 0.39). * p < 0.05, ** p < 0.01.
Figure 2
Figure 2
Relative expression of HMGB1 and TGF-β1 in MI patients’ PBMCs, according to the occurrence of adverse LV remodeling six-months-post-MI, based on the >20% increase in LVEDV: (A) significant upregulation of HMGB1 mRNA was detected in patients’ PBMCs with adverse remodeling (N = 18) compared to patients without adverse remodeling (N = 77) (0.046 ± 0.018 vs. 0.036 ± 0.013, p = 0.04); (B) TGF-β1 mRNA expression was not significantly different between patients with adverse remodeling and patients without adverse remodeling (0.565 ± 0.173 vs. 0.497 ± 0.148, p = 0.15); (C) BIRC3 mRNA expression did not differ significantly between patients with adverse remodeling and patients without adverse remodeling (0.013 ± 0.005 vs. 0.014 ± 0.007, p = 0.48); (D) ADAM17 mRNA expression did not differ significantly between the two patient groups (adverse LVR: 0.009 ± 0.002 vs. without adverse LVR: 0.009 ± 0.005, p = 0.15); (E) CDKN1A mRNA expression was not significantly different between patients with adverse remodeling and patients without adverse remodeling (0.031 ± 0.014 vs. 0.027 ± 0.017, p = 0.22); (F) FTO mRNA expression did not differ significantly between patients with adverse remodeling and patients without adverse remodeling (0.006 ± 0.003 vs. 0.005 ± 0.002, p = 0.14). * p < 0.05. ns: no significance.
Figure 3
Figure 3
Relative expression of HMGB1 in the PBMCs of patients with MI with regard to the reference values of the following echocardiographic parameters: LVEDD, LVESD, LVEDVi, LVESVi, LVEF, and LVE measured six-months-post-MI. Relative mRNA expression is presented as the 2−∆Ct value for each sample. The delta Ct value was calculated from the difference between the Ct value of the gene of interest and that of Cyclophilin A. Data are presented as mean 2−∆Ct ± SD for both groups (normal, reference—circles; dilated/impaired—squares). The Mann–Whitney U test was used to calculate the difference in mRNAs’ relative expression between groups. (A) Significant upregulation of HMGB1 mRNA was detected in PBMCs from patients with dilated LVEDD (N = 40) compared to the patients with normal reference LVEDD (N = 55) (0.042 ± 0.017 vs. 0.035 ± 0.012, p = 0.03); (B) HMGB1 mRNA expression did not differ significantly between patients with dilated LVESD (N = 19) and patients with normal reference LVESD (N = 76) (0.044 ± 0.018 vs. 0.037 ± 0.013, p = 0.11); (C) significant upregulation of HMGB1 mRNA was detected in PBMCs from patients with (mildly, moderately, and severely) dilated LVEDVi (N = 12) compared to the patients with normal reference LVEDVi (N = 83) (0.047 ± 0.018 vs. 0.037 ± 0.014, p = 0.03); (D) significant upregulation of HMGB1 mRNA was detected in PBMCs from patients with severely dilated LVESVi (N = 19) compared to the patients with reference and mildly and moderately dilated LVESVi (N = 76) (0.045 ± 0.015 vs. 0.036 ± 0.014, p = 0.006); (E) significant upregulation of HMGB1 mRNA was detected in PBMCs from patients with borderline low, impaired, and severely impaired LVEF (N = 76) compared to the patients with normal reference LVEF (N = 19) (0.040 ± 0.014 vs. 0.032 ± 0.013, p = 0.01); (F) significant upregulation of HMGB1 mRNA was detected in PBMCs from patients with LV enlargement (N = 37) compared to the patients without LV enlargement (N = 58) (0.043 ± 0.016 vs. 0.035 ± 0.012, p = 0.03). * p < 0.05, ** p < 0.01. ns: no significance.

Similar articles

Cited by

References

    1. Frangogiannis N.G. Pathophysiology of Myocardial Infarction. Compr. Physiol. 2015;5:1841–1875. doi: 10.1002/cphy.c150006. - DOI - PubMed
    1. Thankam F.G., Agrawal D.K. Infarct Zone: A Novel Platform for Exosome Trade in Cardiac Tissue Regeneration. J. Cardiovasc. Transl. Res. 2020;13:686–701. doi: 10.1007/s12265-019-09952-8. - DOI - PMC - PubMed
    1. Frangogiannis N.G. The extracellular matrix in myocardial injury, repair, and remodeling. J. Clin. Investig. 2017;127:1600–1612. doi: 10.1172/JCI87491. - DOI - PMC - PubMed
    1. Galli A., Lombardi F. Postinfarct Left Ventricular Remodelling: A Prevailing Cause of Heart Failure. Cardiol. Res. Pract. 2016;2016:2579832. doi: 10.1155/2016/2579832. - DOI - PMC - PubMed
    1. Bulluck H., Go Y.Y., Crimi G., Ludman A.J., Rosmini S., Abdel-Gadir A., Bhuva A.N., Treibel T.A., Fontana M., Pica S., et al. Defining left ventricular remodeling following acute ST-segment elevation myocardial infarction using cardiovascular magnetic resonance. J. Cardiovasc. Magn. Reson. 2017;19:26. doi: 10.1186/s12968-017-0343-9. - DOI - PMC - PubMed

MeSH terms

LinkOut - more resources