. 2024 Sep 27;12(10):2205.
doi: 10.3390/biomedicines12102205.

Exploring Liraglutide in Lithium-Pilocarpine-Induced Temporal Lobe Epilepsy Model in Rats: Impact on Inflammation, Mitochondrial Function, and Behavior

Affiliations

Exploring Liraglutide in Lithium-Pilocarpine-Induced Temporal Lobe Epilepsy Model in Rats: Impact on Inflammation, Mitochondrial Function, and Behavior

Fatma Merve Antmen et al. Biomedicines. .

Abstract

Background/Objectives: Glucagon-like peptide-1 receptor agonists such as liraglutide are known for their neuroprotective effects in neurodegenerative disorders, but their role in temporal lobe epilepsy (TLE) remains unclear. We aimed to investigate the effects of liraglutide on several biological processes, including inflammation, antioxidant defense mechanisms, mitochondrial dynamics, and function, as well as cognitive and behavioral changes in the TLE model. Methods: Low-dose, repeated intraperitoneal injections of lithium chloride-pilocarpine hydrochloride were used to induce status epilepticus (SE) in order to develop TLE in rats. Fifty-six male Sprague Dawley rats were subjected and allocated to the groups. The effects of liraglutide on inflammatory markers (NLRP3, Caspase-1, and IL-1β), antioxidant pathways (Nrf-2 and p-Nrf-2), and mitochondrial dynamics proteins (Pink1, Mfn2, and Drp1) were evaluated in hippocampal tissues via a Western blot. Mitochondrial function in peripheral blood mononuclear cells (PBMCs) was examined using flow cytometry. Cognitive-behavioral outcomes were assessed using the open-field, elevated plus maze, and Morris water maze tests. Results: Our results showed that liraglutide modulates NLRP3-mediated inflammation, reduces oxidative stress, and triggers antioxidative pathways through Nrf2 in SE-induced rats. Moreover, liraglutide treatment restored Pink1, Mfn2, and Drp1 levels in SE-induced rats. Liraglutide treatment also altered the mitochondrial function of PBMCs in both healthy and epileptic rats. This suggests that treatment can modulate mitochondrial dynamics and functions in the brain and periphery. Furthermore, in the behavioral aspect, liraglutide reversed the movement-enhancing effect of epilepsy. Conclusions: This research underscores the potential of GLP-1RAs as a possibly promising therapeutic strategy for TLE.

Keywords: antioxidant pathways; behavior; epilepsy; inflammation; liraglutide; mitochondria.


Conflict of interest statement

The authors declare no conflicts of interest.

Figures

Figure 1
Figure 1
Timeline and experimental design (created using BioRender.com).
Figure 2
Figure 2
Western blotting of neuroinflammation-related proteins in hippocampal tissues of rats. (af) Relative expression of NLRP3, Caspase-1, and IL-1β protein bands were quantified using Image Lab. Actin was used for internal loading control. The plots show “median ± IQR” with each point corresponding to the measurement from a single animal. Comparisons of sample groups with either the control (C) group (* p < 0.05) or the E+SAL group (# p < 0.05) were performed via a Mann–Whitney U test. NLRP3, nucleotide-binding oligomerization domain-like receptor pyrin domain containing 3; IL-1β, interleukin-1β; C, control group (circles); LIR, liraglutide control group (squares); E+SAL, SE-induced group (triangles up); E+LIR, SE-induced and liraglutide-treated group (triangles down).
Figure 2
Figure 2
Western blotting of neuroinflammation-related proteins in hippocampal tissues of rats. (af) Relative expression of NLRP3, Caspase-1, and IL-1β protein bands were quantified using Image Lab. Actin was used for internal loading control. The plots show “median ± IQR” with each point corresponding to the measurement from a single animal. Comparisons of sample groups with either the control (C) group (* p < 0.05) or the E+SAL group (# p < 0.05) were performed via a Mann–Whitney U test. NLRP3, nucleotide-binding oligomerization domain-like receptor pyrin domain containing 3; IL-1β, interleukin-1β; C, control group (circles); LIR, liraglutide control group (squares); E+SAL, SE-induced group (triangles up); E+LIR, SE-induced and liraglutide-treated group (triangles down).
Figure 3
Figure 3
Western blotting of antioxidant pathway-related proteins in hippocampal tissues of rats. (ac) The relative expression of Nrf2 and p-Nrf2 protein bands was quantified using Image Lab. Actin was used as an internal loading control. (d) The ratio of p-Nrf2 to total Nrf2. The plots show “median ± IQR” with each point corresponding to the measurement from a single animal. Comparisons of sample groups with either the control (C) group (* p < 0.05) or the E+SAL group (# p < 0.05) were performed via a Mann–Whitney U test. Nrf2, nuclear factor E2-related factor 2; p-Nrf2, phosphor-Nrf2; C, control group (circles); LIR, liraglutide control group (squares); E+SAL, SE-induced group (triangles up); E+LIR, SE-induced and liraglutide-treated group (triangles down).
Figure 4
Figure 4
Variations in (a) MDA and (b) GSH levels in hippocampal tissues of rats. The plots show “median ± IQR” with each point corresponding to the measurement from a single animal. Comparisons of sample groups with either the control (C) group (* p < 0.05 and ** p < 0.001) or the E+SAL group (## p < 0.001) were performed via a Mann–Whitney U test. MDA, malondialdehyde; GSH, glutathione; C, control group (circles); LIR, liraglutide control group (squares); E+SAL, SE-induced group (triangles up); E+LIR, SE-induced and liraglutide-treated group (triangles down).
Figure 5
Figure 5
Western blotting mitochondrial dynamics-related proteins in hippocampal tissues of rats. (ad) Relative expression of Pink1, Mfn2, and Drp1 protein bands was quantified using Image Lab. Actin was used as an internal loading control. The plots show “median ± IQR” with each point corresponding to the measurement from a single animal. Comparisons of sample groups with either the control (C) group (* p < 0.05) or the E+SAL group (# p < 0.05) were performed via a Mann–Whitney U test. Pink1, PTEN-induced kinase 1; Mfn2, mitofusin 2; Drp1, dynamin-related protein-1; C, control group (circles); LIR, liraglutide control group (squares); E+SAL, SE-induced group (triangles up); E+LIR, SE-induced and liraglutide-treated group (triangles down).
Figure 5
Figure 5
Western blotting mitochondrial dynamics-related proteins in hippocampal tissues of rats. (ad) Relative expression of Pink1, Mfn2, and Drp1 protein bands was quantified using Image Lab. Actin was used as an internal loading control. The plots show “median ± IQR” with each point corresponding to the measurement from a single animal. Comparisons of sample groups with either the control (C) group (* p < 0.05) or the E+SAL group (# p < 0.05) were performed via a Mann–Whitney U test. Pink1, PTEN-induced kinase 1; Mfn2, mitofusin 2; Drp1, dynamin-related protein-1; C, control group (circles); LIR, liraglutide control group (squares); E+SAL, SE-induced group (triangles up); E+LIR, SE-induced and liraglutide-treated group (triangles down).
Figure 6
Figure 6
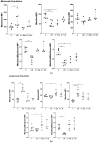
Measurement of mitochondrial function in PMBCs. Rat PBMCs were isolated using the density-gradient centrifugation method. The fluorescence intensities of MitoTracker Green, MitoTracker Red CMXRos, and MitoSox were measured in (a) monocyte and (b) lymphocyte populations. Furthermore, to estimate normalized MMP and MitoSOX, the MitoTracker Red CMXRos/ MitoTracker Green and MitoSox/MitoTracker Green ratios were calculated, respectively. The plots show “median ± IQR” with each point corresponding to the measurement from a single animal. Comparisons of sample groups with the control (C) group (* p < 0.05, ** p < 0.001, and *** p < 0.0001) were performed using a Mann–Whitney U test. C, control group; LIR, liraglutide control group; E+SAL, SE-induced group; E+LIR, SE-induced and liraglutide-treated group.
Figure 7
Figure 7
The effects of liraglutide treatment (300 µg/kg; 300 µg/1 mL/day) on locomotor activity in rats. The plots show “mean ± SD” with each point corresponding to the measurement from a single animal. A post hoc analysis for multiple comparisons was performed using Tukey’s HSD test after one-way ANOVA (*** p < 0.0001, # p < 0.05). C, control group (circles); LIR, liraglutide control group (squares); E+SAL, SE-induced group (triangles up); E+LIR, SE-induced and liraglutide-treated group (triangles down).
Figure 8
Figure 8
The effects of liraglutide treatment (300 µg/kg; 300 µg/1 mL/day) on anxiety-related behavior in rats. The percentage of total time spent in (a) closed and (b) open arms of the EPM. The plots show “mean ± SD” with each point corresponding to the measurement from a single animal. A post hoc analysis for multiple comparisons was performed using Tukey’s HSD test after a one-way ANOVA (* p < 0.05 and ** p < 0.001). C, control group (circles); LIR, liraglutide control group (squares); E+SAL, SE-induced group (triangles up); E+LIR, SE-induced and liraglutide-treated group (triangles down).
Figure 9
Figure 9
The effects of liraglutide treatment (300 µg/kg; 300 µg/1 mL/day) on learning and memory abilities in rats. (a) The escape latency and (b) time spent in the target quadrant during the MWM test. A repeated-measures ANOVA was used to analyze the escape latency data. The plots show “mean ± SD” with each point corresponding to the measurement from a single animal. A post hoc analysis for multiple comparisons was performed using Tukey’s HSD test (* p < 0.05, **** p < 0.00001 compared with the C group; ## p < 0.001 compared with the E+SAL group; && p < 0.001, &&& p < 0.0001, &&&& p < 0.00001 compared with day 1 in their group). C, control group (circles); LIR, liraglutide control group (squares); E+SAL, SE-induced group (triangles up); E+LIR, SE-induced and liraglutide-treated group (triangles down).

References

    1. Thijs R.D., Surges R., O’Brien T.J., Sander J.W. Epilepsy in adults. Lancet. 2019;393:689–701. doi: 10.1016/S0140-6736(18)32596-0. - DOI - PubMed
    1. Amlerova J., Sroubek J., Angelucci F., Hort J. Evidences for a Role of Gut Microbiota in Pathogenesis and Management of Epilepsy. Int. J. Mol. Sci. 2021;22:5576. doi: 10.3390/ijms22115576. - DOI - PMC - PubMed
    1. Keezer M.R., Sisodiya S.M., Sander J.W. Comorbidities of epilepsy: Current concepts and future perspectives. Lancet Neurol. 2016;15:106–115. doi: 10.1016/S1474-4422(15)00225-2. - DOI - PubMed
    1. Beghi E., Giussani G. Treatment of epilepsy in light of the most recent advances. Lancet Neurol. 2019;18:7–8. doi: 10.1016/S1474-4422(18)30412-5. - DOI - PubMed
    1. Blair R.D. Temporal lobe epilepsy semiology. Epilepsy Res. Treat. 2012;2012:751510. doi: 10.1155/2012/751510. - DOI - PMC - PubMed

LinkOut - more resources