. 2024 Oct 1;12(10):2236.
doi: 10.3390/biomedicines12102236.

Comprehensive Bioinformatics Analysis Reveals the Potential Role of the hsa_circ_0001081/miR-26b-5p Axis in Regulating COL15A1 and TRIB3 within Hypoxia-Induced miRNA/mRNA Networks in Glioblastoma Cells

Affiliations

Comprehensive Bioinformatics Analysis Reveals the Potential Role of the hsa_circ_0001081/miR-26b-5p Axis in Regulating COL15A1 and TRIB3 within Hypoxia-Induced miRNA/mRNA Networks in Glioblastoma Cells

Bartosz Lenda et al. Biomedicines. .

Abstract

Background/Objectives: The intrinsic molecular heterogeneity of glioblastoma (GBM) is one of the main reasons for its resistance to conventional treatment. Mesenchymal GBM niches are associated with hypoxic signatures and a negative influence on patients' prognosis. To date, competing endogenous RNA (ceRNA) networks have been shown to have a broad impact on the progression of various cancers. In this study, we decided to construct hypoxia-specific microRNA/ messengerRNA (miRNA/mRNA) networks with a putative circular RNA (circRNA) regulatory component using available bioinformatics tools. Methods: For ceRNA network construction, we combined publicly available data deposited in the Gene Expression Omnibus (GEO) and interaction pairs obtained from miRTarBase and circBank; a differential expression analysis of GBM cells was performed with limma and deseq2. For the gene ontology (GO) enrichment analysis, we utilized clusterProfiler; GBM molecular subtype analysis was performed in the Glioma Bio Discovery Portal (Glioma-BioDP). Results: We observed that miR-26b-5p, generally considered a tumor suppressor, was upregulated under hypoxic conditions in U-87 MG cells. Moreover, miR-26b-5p could potentially inhibit TRIB3, a gene associated with tumor proliferation. Protein-protein interaction (PPI) network and GO enrichment analyses identified a hypoxia-specific subcluster enriched in collagen-associated terms, with six genes highly expressed in the mesenchymal glioma group. This subcluster included hsa_circ_0001081/miR-26b-5p-affected COL15A1, a gene downregulated in hypoxic U-87 MG cells yet highly expressed in the mesenchymal GBM subtype. Conclusions: The interplay between miR-26b-5p, COL15A1, and TRIB3 suggests a complex regulatory mechanism that may influence the extracellular matrix composition and the mesenchymal transformation in GBM. However, the precise impact of the hsa_circ_0001081/miR-26b-5p axis on collagen-associated processes in hypoxia-induced GBM cells remains unclear and warrants further investigation.

Keywords: GBM mesenchymal subtype; GBM molecular subtype; U-87 MG cells; bioinformatics; ceRNA; collagen; glioblastoma.


Conflict of interest statement

The authors declare no conflicts of interest. The funders had no role in the design of the study, in the collection, analyses, or interpretation of data, in the writing of the manuscript, or in the decision to publish the results.

Figures

Figure 1
Figure 1
General workflow of the bioinformatics analysis. By using limma and deseq2, we conducted differential expression (DE) analyses of three publicly available datasets deposited in the Gene Expression Omnibus (GEO). Both mRNA and miRNA data consisted of U-87 MG cells treated with hypoxia and normoxia, while circRNA data consisted of GBM patient-derived cells and neural progenitor cells as a control group. By intersecting the results of DE analyses with corresponding interaction pairs from miRTarBase and circBank, we constructed putative ceRNA networks. Note that we concurrently constructed two types of networks according to the ceRNA hypothesis (this is omitted in Figure 1 to keep it more concise); this consisted of upDECs/down-hiDEMs/up-hiDEGs and a second one that consisted of down-hiDECs/up-hiDEMs/downDEGs. For all significantly expressed hypoxia-induced genes (hiDEGs; both up- and downregulated), we performed GO enrichment analysis and constructed a PPI network in Cytoscape; the PPI network was further subjected to MCL clustering, and selected clusters were subsequently analyzed with GO enrichment terms. Next, by analyzing different PPI subclusters in the context of the obtained ceRNA and GO enrichment results, we selected the hsa_circ_0001081/miR-26b-5p/TRIB3/COL15A1 axis and its downstream targets for further investigation. To do so, we analyzed the protein-coding components of this axis by molecular subtype and survival analyses using data from Giloma-BioDP and the GDC Data Portal, respectively. For more detailed information about each step of the workflow, see the Materials and Methods section. For utilized R code and generated results, see DOI 10.5281/zenodo.13770443. Figure numbers corresponding to particular steps of the workflow are in brackets. GBM—glioblastoma; hiDEGs—hypoxia-induced genes; hiDEMs—hypoxia-induced miRNA; DECs—hypoxia-induced circRNA; up—upregulated; down—downregulated; PPI—protein–protein interaction; GO—gene ontology; ceRNA—competing endogenous RNA; GDC—Genomic Data Commons; TCGA—The Cancer Genome Atlas; Glioma-BioDP—Glioma Bio Discovery Portal; MCL—Markov Cluster Algorithm (a cluster algorithm for graphs).
Figure 2
Figure 2
Differential expression (DE) analysis of genes in the hypoxia-induced U-87 MG cell line; (A) volcano plot for hypoxia-specific differentially expressed genes (hiDEGs) in U-87 MG cell line, threshold for significant genes (in blue): |log2FC| > 1 and p.adjusted < 0.05; gene ontology enrichment analysis of biological processes (B) and cellular components (C) for hypoxia-specific differentially expressed genes (hiDEGs) in U-87 MG cell line.
Figure 3
Figure 3
Protein–protein interaction (PPI) clusters for hypoxic genes in U-87 cells; (A) PPI network of hypoxia-specific differentially expressed genes (hiDEGs) in U-87 MG cell line with the biggest cluster composed of 57 proteins, where node color corresponds to log2FC values from differential expression (DE) analysis, singletons are omitted; gene ontology enrichment analysis of biological processes (B) and cellular components (C) for the biggest cluster of PPI network in hypoxia-induced U-87 MG cells.
Figure 4
Figure 4
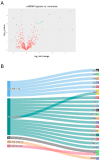
Differential expression analysis of miRNA in hypoxia-induced U-87 MG cell line; (A) volcano plot for hypoxia-specific differentially expressed miRNAs (hiDEMs) in U-87 MG cell line, threshold for significant miRNAs (in blue): |log2FC| > 0.5 and p.adjusted < 0.05; (B) Sankey diagram for hypoxia-specific upregulated miRNAs (up-hiDEMs) and their downstream competing endogenous hypoxia-specific downregulated targets (down-hiDEGs) in hypoxia-induced U-87 MG cell line.
Figure 5
Figure 5
Differential expression (DE) analysis of circRNA in patient-derived GBM cells vs. neural progenitor cells (NPC) and putative GBM-specific ceRNA network construction; (A) volcano plot for differentially expressed circRNAs (DECs) in GBM patient-derived cells as compared to neural progenitor cells (NPC), the threshold for significant circRNA (in blue): |log2FC| > 2 and p.adjusted < 0.05; (B) Sankey diagram of putative GBM ceRNA network of 3 upregulated differentially expressed circRNAs (upDECs), hypoxia-specific downregulated miR-365a-5p, and hypoxia-specific upregulated SGCD; (C) Sankey diagram of putative GBM ceRNA network of downregulated differentially expressed circRNAs (downDECs), hypoxia-specific upregulated miRNAs (up-hiDEMs), and hypoxia-specific downregulated genes (down-hiDEGs).
Figure 6
Figure 6
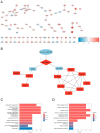
Effect of the hsa_circ_0001081/miR-26b-5p axis on PPI network subclusters; (A) MCL clustering of the PPI network obtained from hypoxia-specific differentially expressed genes (DEGs) in U-87 MG cell line, granularity parameter = 3, node color corresponds to log2FC values from differential expression (DE) analysis of GSE245800 dataset, singletons are omitted; (B) putative GBM ceRNA network of hsa_circ_0001081/miR-26b-5p/COL15A1/TRIB3 and two downstream subclusters obtained from MCL clustering of PPI network; gene ontology enrichment analysis of biological processes (C) and cellular components (D) for COL15A1-containing subcluster of PPI network.
Figure 7
Figure 7
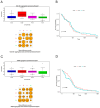
Subtype expression and survival analyses of the TCGA-GBM cohort for (A,B) COL15A1; (C,D) TRIB3; barplottted t-test where p < 0.05 is statistically significant, and a log-rank p < 0.05 is statistically significant; C—classical GBM subtype; M—mesenchymal GBM subtype; P—proneural GBM subtype; N—neural GBM subtype (note that neural subtype is no longer recognized by newer classification); numbers under box plots refer to the size of the individual subgroups.
Figure 8
Figure 8
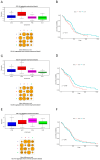
Subtype expression and survival analyses of TCGA-GBM cohort for genes included in COL15A1-affected subcluster from PPI network; (A,B) COL1A1, (C,D) COL5A1, (E,F) COL11A1, (G,H) ITGA5, (I,J) LEPREL1 (P3H2), (K,L) LUM, and (M,N) PLOD2; barplottted t-test p < 0.05 is statistically significant, log-rank p < 0.05 is statistically significant. C—classical GBM subtype; M—mesenchymal GBM subtype; P—proneural GBM subtype; N—neural GBM subtype (note that neural subtype is no longer recognized by newer classification); numbers under box plots refer to the size of the individual subgroups.
Figure 8
Figure 8
Subtype expression and survival analyses of TCGA-GBM cohort for genes included in COL15A1-affected subcluster from PPI network; (A,B) COL1A1, (C,D) COL5A1, (E,F) COL11A1, (G,H) ITGA5, (I,J) LEPREL1 (P3H2), (K,L) LUM, and (M,N) PLOD2; barplottted t-test p < 0.05 is statistically significant, log-rank p < 0.05 is statistically significant. C—classical GBM subtype; M—mesenchymal GBM subtype; P—proneural GBM subtype; N—neural GBM subtype (note that neural subtype is no longer recognized by newer classification); numbers under box plots refer to the size of the individual subgroups.

Similar articles

References

    1. Louis D.N., Perry A., Wesseling P., Brat D.J., Cree I.A., Figarella-Branger D., Hawkins C., Ng H.K., Pfister S.M., Reifenberger G., et al. The 2021 WHO Classification of Tumors of the Central Nervous System: A summary. Neuro Oncol. 2021;23:1231–1251. doi: 10.1093/neuonc/noab106. - DOI - PMC - PubMed
    1. Grochans S., Cybulska A.M., Simińska D., Korbecki J., Kojder K., Chlubek D., Baranowska-Bosiacka I. Epidemiology of Glioblastoma Multiforme–Literature Review. Cancers. 2022;14:2412. doi: 10.3390/cancers14102412. - DOI - PMC - PubMed
    1. Chai R., Fang S., Pang B., Liu Y., Wang Y., Zhang W., Jiang T. Molecular pathology and clinical implications of diffuse glioma. Chin. Med. J. 2022;135:2914–2925. doi: 10.1097/CM9.0000000000002446. - DOI - PMC - PubMed
    1. Martínez A.H., Madurga R., García-Romero N., Ayuso-Sacido Á. Unravelling glioblastoma heterogeneity by means of single-cell RNA sequencing. Cancer Lett. 2022;527:66–79. doi: 10.1016/j.canlet.2021.12.008. - DOI - PubMed
    1. Torrisi F., Alberghina C., D’aprile S., Pavone A.M., Longhitano L., Giallongo S., Tibullo D., Di Rosa M., Zappalà A., Cammarata F.P., et al. The Hallmarks of Glioblastoma: Heterogeneity, Intercellular Crosstalk and Molecular Signature of Invasiveness and Progression. Biomedicines. 2022;10:806. doi: 10.3390/biomedicines10040806. - DOI - PMC - PubMed

LinkOut - more resources