. 2024 Oct 11;12(10):2318.
doi: 10.3390/biomedicines12102318.

Use of a Novel Whole Blood Separation and Transport Device for Targeted and Untargeted Proteomics

Affiliations

Use of a Novel Whole Blood Separation and Transport Device for Targeted and Untargeted Proteomics

Colin T McDowell et al. Biomedicines. .

Abstract

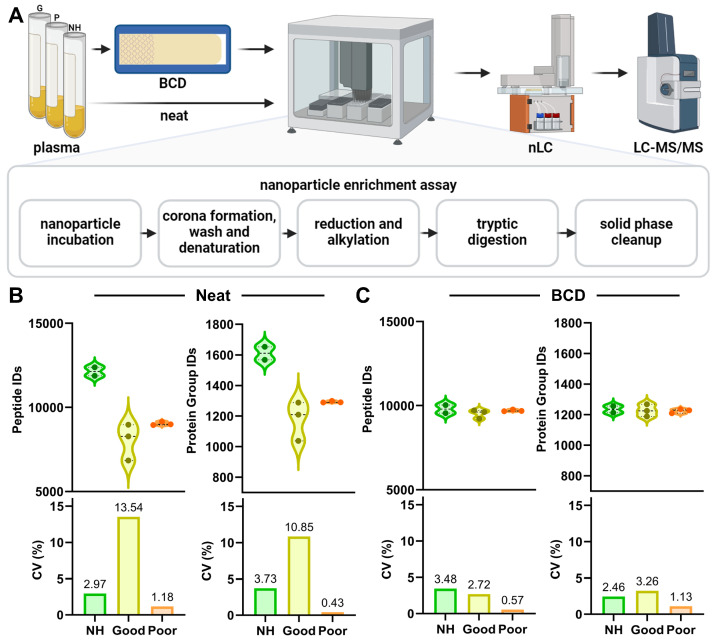
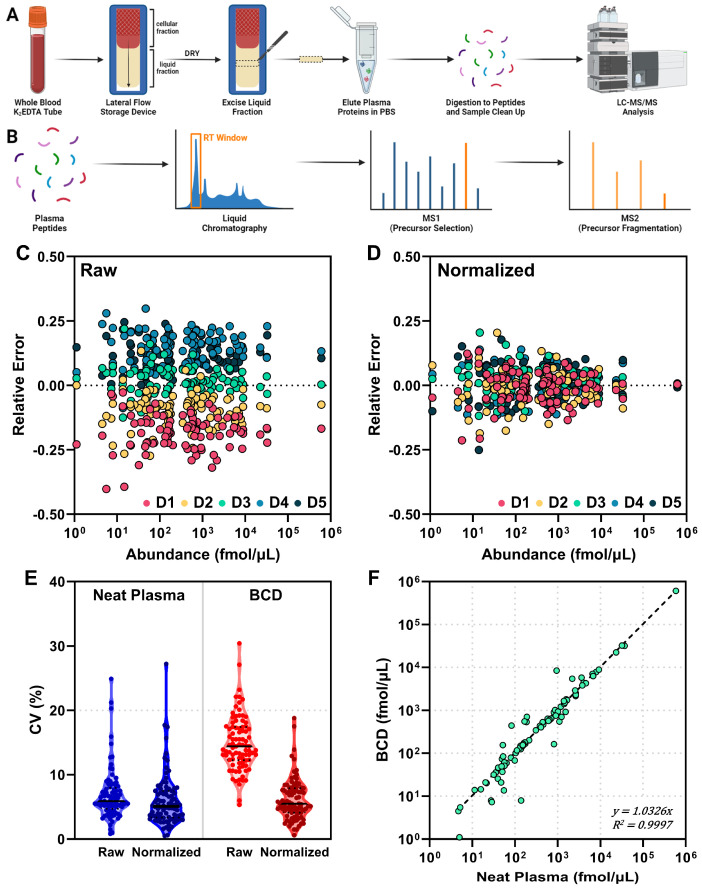
Background: There is significant interest in developing alternatives to traditional blood transportation and separation methods, which often require centrifugation and cold storage to preserve specimen integrity. Here we provide new performance findings that characterize a novel device that separates whole blood via lateral flow then dries the isolated components for room temperature storage and transport.

Methods: Untargeted proteomics was performed on non-small cell lung cancer (NSCLC) and normal healthy plasma applied to the device or prepared neat.

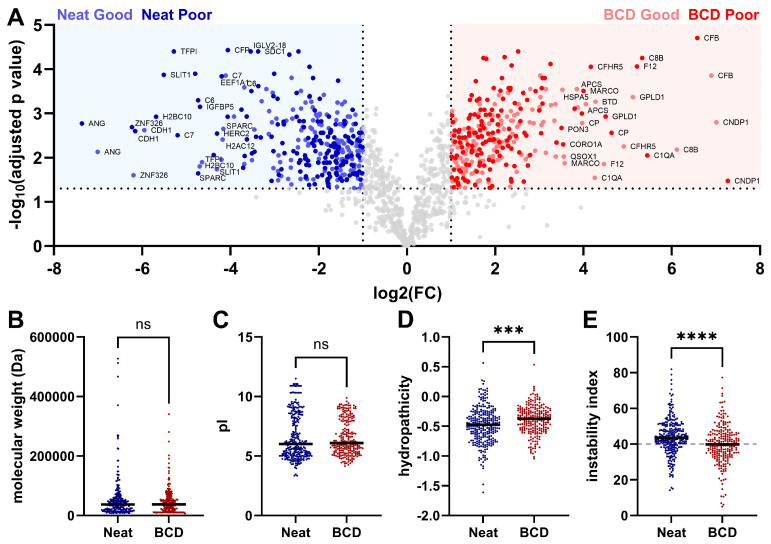
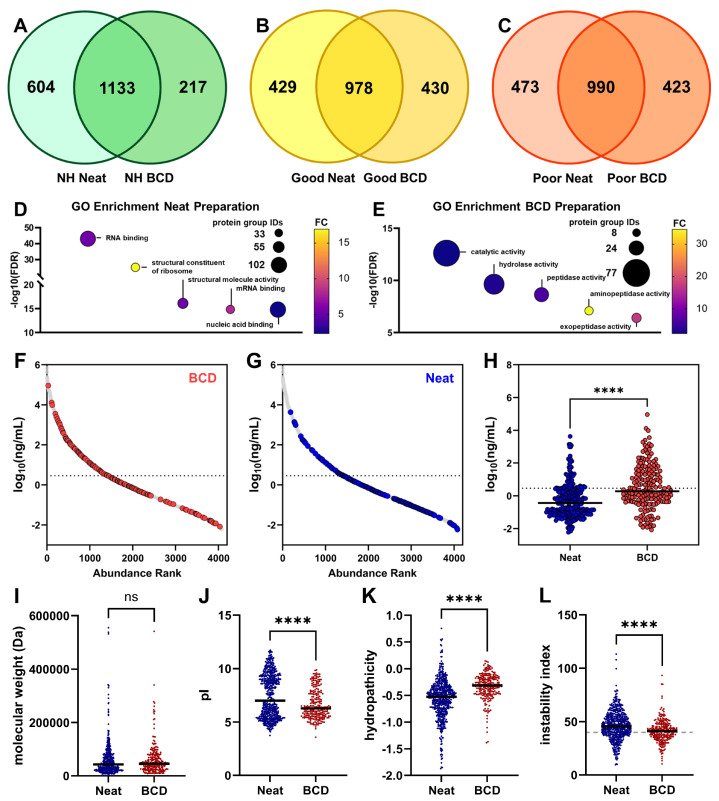
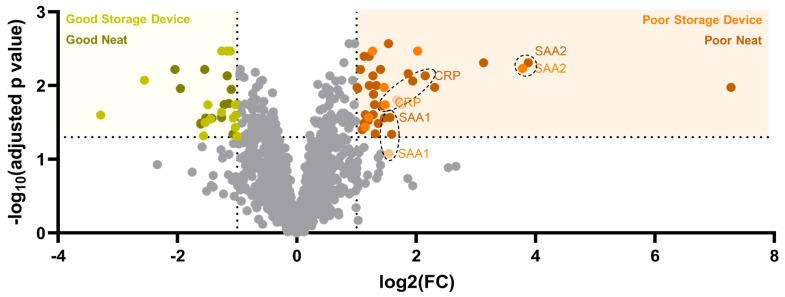
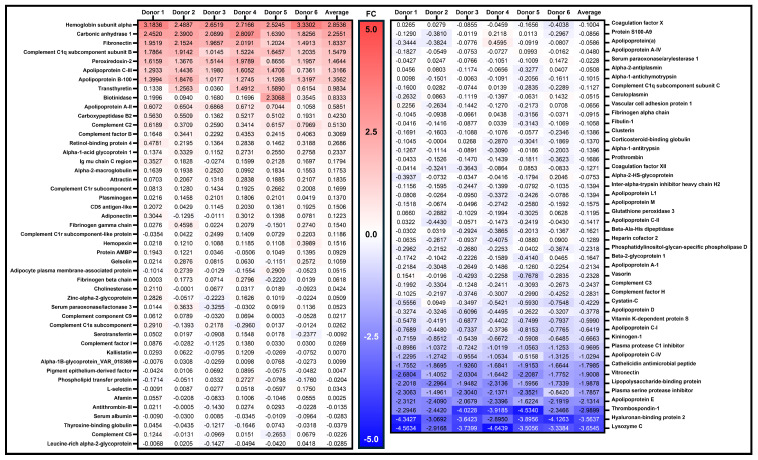
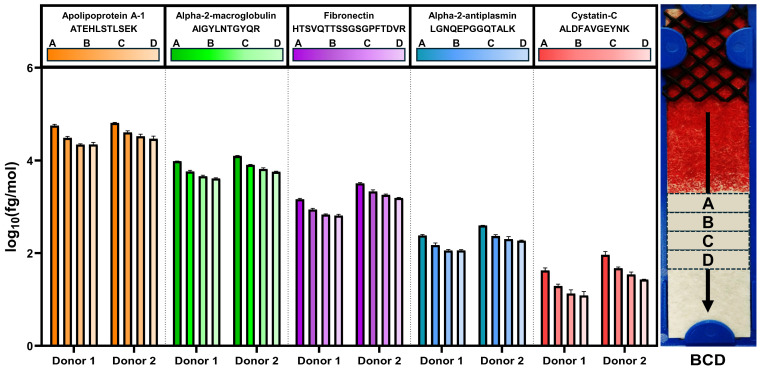
Results: Significantly, proteomic profiles from the storage device were more reproducible than from neat plasma. Proteins depleted or absent in the device preparation were shown to be absorbed onto the device membrane through largely hydrophilic interactions. Use of the device did not impact proteins relevant to an NSCLC clinical immune classifier. The device was also evaluated for use in targeted proteomics experiments using multiple-reaction monitoring (MRM) mass spectrometry. Intra-specimen detection intensity for protein targets between neat and device preparations showed a strong correlation, and device variation was comparable to the neat after normalization. Inter-specimen measurements between the device and neat preparations were also highly concordant.

Conclusions: These studies demonstrate that the lateral flow device is a viable blood separation and transportation tool for untargeted and targeted proteomics applications.

Keywords: LC-MS/MS; lateral flow; mass spectrometry; plasma proteomics.


Conflict of interest statement

Colin T. McDowell, Amanda L. Weaver, Nathan K. Keiser, Charles M. Nichols and Gary A. Pestano either are or were employed by Biodesix, Inc. The remaining author declares that the research was conducted in the absence of any commercial or financial relationships that could be construed as a potential conflict of interest.

Figures

Figure 1
Figure 1
Application of plasma to the BCD reduces variability in protein group identification. (A) Overview workflow of neat and device sample preparation for discovery proteomics, including nanoparticle enrichment, enzymatic digestion, chromatographic separation and MS analysis. Violin plots and associated CV measurements for peptide and protein group identifications in (B) Neat and (C) BCD preparations of the normal healthy (NH, green), NSCLC “Good” (yellow) and NSCLC “Poor” (orange) plasma pools are shown. BCD, blood collection device.
Figure 2
Figure 2
Differential enrichment of plasma proteoforms between the BCD and neat preparations in immune classifier-stratified plasma pools. (A) Overlaid volcano plots of “Good” and “Poor” NSCLC plasma prepared neat and on the device (“Good” on device, light red; “Good” neat, light blue; “Poor” on device, dark red; “Poor” neat, dark blue; log2 FC > 1, −log10 adjusted p value > 1.3 [<0.05]). Physiochemical characterization of neat- (blue) and BCD-associated (red) protein groups, including (B) molecular weight, (C) pI, (D) hydropathicity and (E) instability index (stable:unstable demarcation of 40 marked in gray). FC, fold change; ns, not significant. ***, p < 0.001 and ****, p < 0.0001.
Figure 3
Figure 3
Preparation-specific protein groups. Venn diagrams for proteoforms detected in the neat and BCD preparations of (A) normal healthy, (B) NSCLC “Good” and (C) NSCLC “Poor” plasma pools. (D) GO enrichment analysis for molecular functions in the neat preparation-specific proteoforms across NH, NSCLC “Good” and NSCLC “Poor” plasma pools reveals conserved nucleic acid binding capacity. (E) GO enrichment analysis for the BCD-specific proteins showed shared enzymatic functions. Distribution of (F) protein groups detected exclusively with the use of the BCD (red) and (G) protein groups detected exclusively in the neat preparation (blue) compared to 4077 abundance-ranked proteins from the human plasma proteome project (HPPP, build 2021-07, grey). The dotted lines at 0.46 log10 (ng/mL) denote median abundance. (H) Protein groups detected exclusively in the BCD preparation were significantly more abundant in human plasma than protein groups detected only in the neat preparation. Physiochemical characterization of neat- (blue) and BCD-associated (red) protein groups, including (I) molecular weight, (J) pI, (K) hydropathicity and (L) instability index (stable:unstable demarcation of 40 marked in gray). FC, fold change; NH, normal healthy; ns, not significant. ****, p < 0.0001.
Figure 4
Figure 4
Proteins utilized by the immune classifier are not significantly retained on the BCD. Overlaid volcano plots of proteins significantly associated with NSCLC “Poor” (light orange, prepared on the BCD; dark orange, prepared neat) and NSCLC “Good” (light yellow, prepared on the BCD; dark yellow, prepared neat) plasma are shown. Serum amyloid A1 (SAA1), serum amyloid A2 (SAA2) and C-reactive protein (CRP) are enriched in the NSCLC “Poor” plasma pool regardless of preparation method.
Figure 5
Figure 5
Correlation between targeted proteomic measurements on the BCD and in neat plasma. (A) Sample preparation workflow for plasma applied to the BCD. (B) Outline of targeted LC-MS/MS. (C) Raw (non-normalized) and (D) total protein normalized relative error (average measurement—single measurement/average measurement) for 89 proteins across five devices (D1, red; D2, orange; D3, teal; D4, light blue; and D5, dark blue). (E) Violin plots for raw and normalized protein measurement CV for the neat (blue) and BCD (red) preparations. The FDA 20% CV threshold is demarcated in gray. (F) Correlation plot for normalized neat and BCD measurements of 89 proteins, averaged across all devices. Dashed line, perfect correlation.
Figure 6
Figure 6
Heat map of normalized inter-donor protein abundance changes. The ratio of BCD/neat protein measurements across all six donors. Proteins highlighted in blue or red show a higher fold change in the BCD or in the neat preparations, respectively. The data were normalized to total protein content as previously described. FC, fold change.
Figure 7
Figure 7
Representative protein concentrations in plasma recovered after lateral flow separation of whole blood. A representative image of a BCD post-whole blood separation is shown on the right, annotated with sections A–D, which were each 0.5 cm wide. Normalized concentrations for ATEHLSTLSEK, AIGYLNTGYQR, HTSVQTTSSGSGPFTDVR, LGNQEPGGQTALK and ALDFAVGEYNK peptides corresponding to apolipoprotein A-1, alpha-2-macroglobulin, fibronectin, alpha-2-antiplasmin and cystatin-C, respectively, are shown for each section for each donor. BCD, blood collection device.

Similar articles

References

    1. Anderson N.L. The Clinical Plasma Proteome: A Survey of Clinical Assays for Proteins in Plasma and Serum. Clin. Chem. 2010;56:177–185. doi: 10.1373/clinchem.2009.126706. - DOI - PubMed
    1. Anderson N.L., Anderson N.G. The Human Plasma Proteome: History, Character, and Diagnostic Prospects. Mol. Cell. Proteom. 2002;1:845–867. doi: 10.1074/mcp.R200007-MCP200. - DOI - PubMed
    1. Chambers A.G., Percy A.J., Yang J., Borchers C.H. Multiple Reaction Monitoring Enables Precise Quantification of 97 Proteins in Dried Blood Spots. Mol. Cell Proteom. 2015;14:3094. doi: 10.1074/mcp.O115.049957. - DOI - PMC - PubMed
    1. Li W., Tse F.L.S. Dried Blood Spot Sampling in Combination with LC-MS/MS for Quantitative Analysis of Small Molecules. Biomed. Chromatogr. 2010;24:49–65. doi: 10.1002/bmc.1367. - DOI - PubMed
    1. Wagner M., Tonoli D., Varesio E., Hopfgartner G. The Use of Mass Spectrometry to Analyze Dried Blood Spots. Mass. Spectrom. Rev. 2016;35:361–438. doi: 10.1002/mas.21441. - DOI - PubMed

LinkOut - more resources