. 2024 Oct 15;12(10):2343.
doi: 10.3390/biomedicines12102343.

Altered PLCβ/IP3/Ca2+ Signaling Pathway Activated by GPRCs in Olfactory Neuronal Precursor Cells Derived from Patients Diagnosed with Schizophrenia

Affiliations

Altered PLCβ/IP3/Ca2+ Signaling Pathway Activated by GPRCs in Olfactory Neuronal Precursor Cells Derived from Patients Diagnosed with Schizophrenia

Zuly A Sánchez-Florentino et al. Biomedicines. .

Abstract

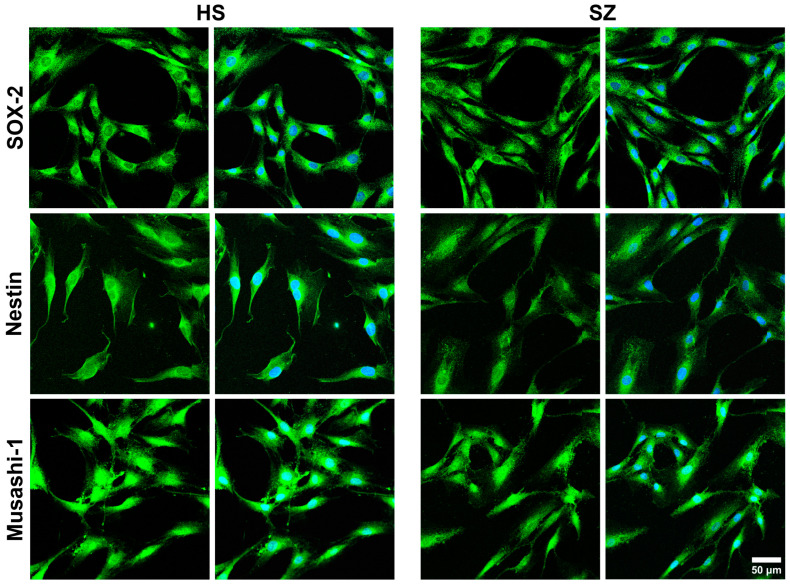
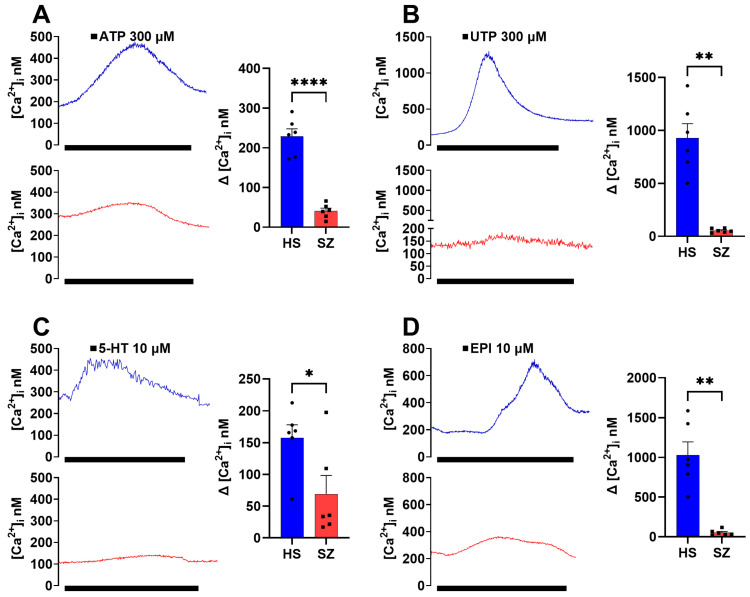
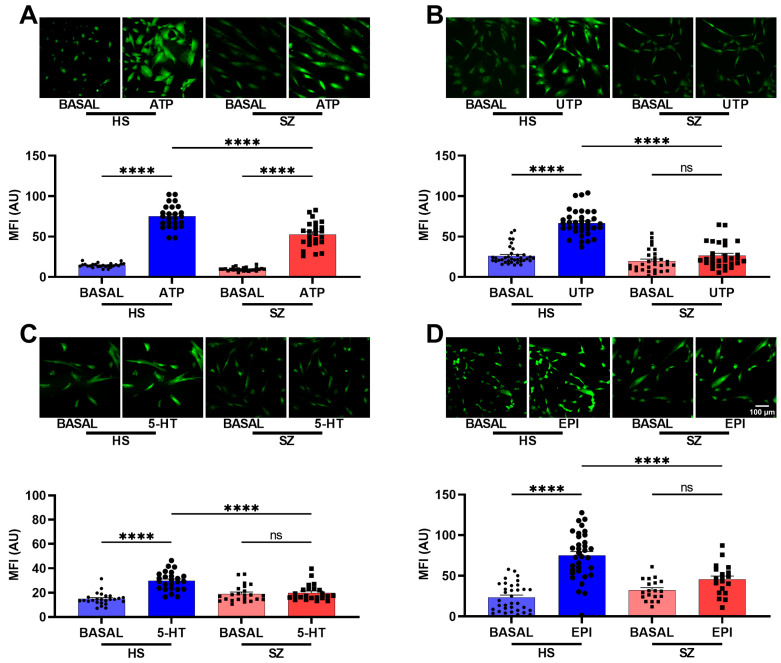
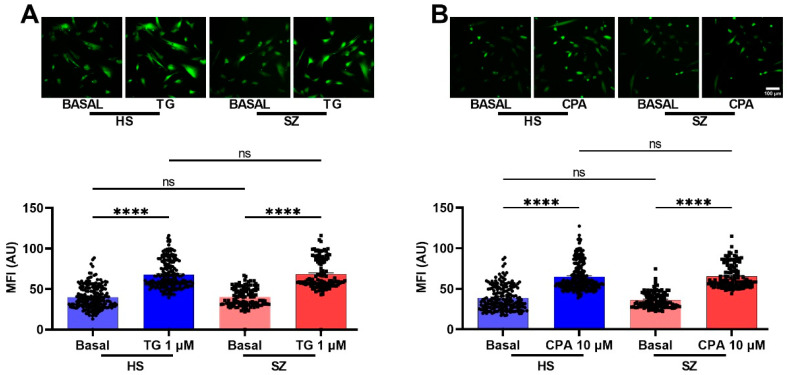
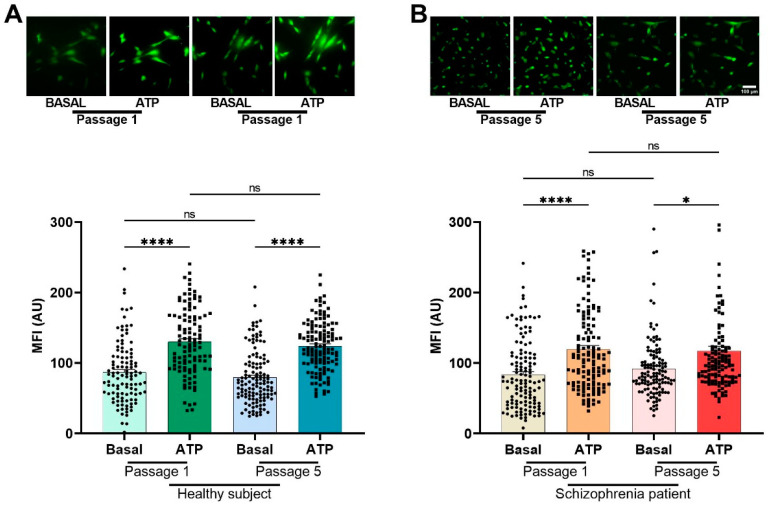
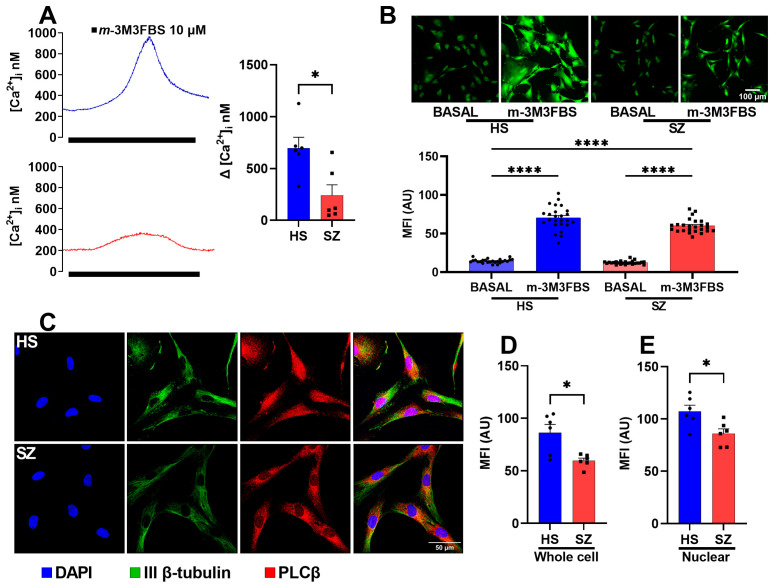
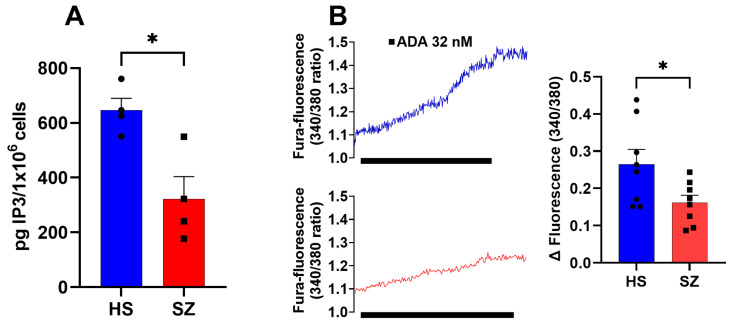
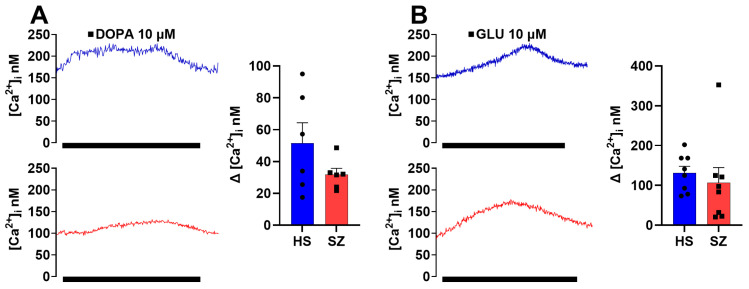
Background: Schizophrenia (SZ) is a multifactorial chronic psychiatric disorder with a worldwide prevalence of 1%. Altered expression of PLCβ occurs in SZ patients, suggesting alterations in the PLCβ/IP3/Ca2+ signaling pathway. This cascade regulates critical cellular processes in all cell types, including the neuronal lineage; however, there is scarce evidence regarding the functionality of this transduction signaling in neuronal cells derived from SZ patients. Objective: We evaluated the functionality of the PLCβ/IP3/Ca2+ pathway in olfactory neuronal precursor cells (hONPCs) obtained from SZ patients. Methods: Cryopreserved hONPCs isolated from SZ patients and healthy subjects (HS) were thawed. The cellular types in subcultures were corroborated by immunodetection of the multipotency and lineage markers SOX-2, Musashi-1, nestin, and β-III tubulin. The PLCβ/IP3/Ca2+ pathway was activated by GPCR (Gq) ligands (ATP, UTP, serotonin, and epinephrine). In addition, PLCβ and IP3R were directly stimulated by perfusing cells with the activators m-3M3FBS and ADA, respectively. Cytosolic Ca2+ was measured by microfluorometry and by Ca2+ imaging. The amount and subcellular distribution of the PLCβ1 and PLCβ3 isoforms were evaluated by confocal immunofluorescence. IP3 concentration was measured by ELISA. Results: The results show that the increase of cytosolic Ca2+ triggered by GPCR ligands or directly through either PLCβ or IP3R activation was significantly lower in SZ-derived hONPCs, regarding HS-derived cells. Moreover, the relative amount of the PLCβ1 and PLCβ3 isoforms and IP3 production stimulated with m-3M3FBS were reduced in SZ-derived cells. Conclusions: Our results suggest an overall functional impairment in the PLCβ/IP3/Ca2+ signaling pathway in SZ-derived hONPCs.

Keywords: IP3; PLCβ; calcium signaling; human olfactory neuronal stem cells; schizophrenia.


Conflict of interest statement

The authors have declared that there are no conflicts of interest concerning the subject of this study.

Figures

Figure 1
Figure 1
Determination of multipotency markers in hONPCs of HS and SZ patients. HS-derived and SZ patient-derived cells exhibit multipotent stem cell characteristics by expressing SOX-2, Musashi-1, and nestin. All cells express the three multipotency markers. DAPI-stained nuclei.
Figure 2
Figure 2
Increase in cytosolic Ca2+ induced by Gq-coupled agonists in single cells of the olfactory epithelium of HS and SZ patients. Cells were cultured for three days to assess changes in intracellular Ca2+ concentration ([Ca2+]i) induced by 300 μM ATP (A), 300 μM UTP (B), 10 μM serotonin (C), and 10 μM epinephrine (D) by microfluorometry using Fura 2-AM. The graphs represent the data obtained from six subjects per group. Each data point represents the average of three technical replicates for each subject. Data were expressed as mean ± SEM and compared using the Student’s t-test with Welch’s correction, * p < 0.05 ** p < 0.01 **** p < 0.001. HS = healthy subject (blue), SZ = schizophrenic patient (red).
Figure 3
Figure 3
Intracellular calcium response after stimulation with Gq-coupled agonists in olfactory epithelial cell populations of HS and patients with SZ. The cells were incubated for 30 min with 4 μM Fluo 4-AM diluted in the culture medium at 37 °C and 5% CO2. Images were captured before stimulation (basal) and 2 min after stimulation with either 300 μM ATP (A), 300 μM UTP (B), 10 μM serotonin (C), and 10 μM epinephrine (D) in HS-derived cells and SZ patient-derived cells. The graphs represent data obtained from at least 18 images (18–20 cells per image) per group. Data were expressed as mean ± SEM and compared using Brown–Forsythe one-way analysis of variance (ANOVA) and Dunnett’s multiple comparison test, **** p < 0.0001. ns: not significant. Mean fluorescence intensity (MFI), arbitrary units (AU).
Figure 4
Figure 4
Intracellular calcium response after stimulation with thapsigargin and CPA in hONPCs of HS and patients with SZ. Images were captured before stimulation (basal) and 2 min after stimulation with either 1 μM thapsigargin (TG, left graph) (A), and 10 μM cyclopiazonic acid (CPA, right graph) (B) in HS and SZ derived cells. No significant differences were found when basal Ca2+ levels were compared (HS vs. SZ), neither when comparing treated cell responses. Highly significant differences were found when basal Ca2+ levels were compared with their respective treatment. The graphs represent data obtained from at least six images (18–20 cells per image) per group. Data were expressed as mean ± SEM and compared using the Kruskal–Wallis test and Dunn’s multiple comparisons test, **** p < 0.0001. ns: not significant. Mean fluorescence intensity (MFI), arbitrary units (AU).
Figure 5
Figure 5
Intracellular calcium response after stimulation with ATP in olfactory epithelial precursor cell populations of HS (A) and SZ (B) patients in passage 1 and passage 5. The cells were incubated for 30 min with 4 μM Fluo 4-AM diluted in the culture medium at 37 °C and 5% CO2. Images were captured before stimulation (basal) and 2 min after stimulation with 300 μM ATP. Each data point represents the mean fluorescence intensity (MFI) measurement of each cell. The MFI of at least 100 cells was determined. The graphs represent data obtained from at least six images (18–20 cells per image) per group. Data were expressed as mean ± SEM and compared using the Kruskal–Wallis and Dunn’s multiple comparisons tests. **** p < 0.0001, * p < 0.05; not significant (ns). AU: arbitrary units.
Figure 6
Figure 6
Cytosolic increase in Ca2+ after direct PLCβ stimulation and the amount of PLCβ protein in cultured cells from HS and patients with SZ. (A) Microfluorometric detection of changes in intracellular Ca2+ concentration ([Ca2+]i) induced by 10 µM m-3M3FBS. (B) Calcium images were captured before stimulation (basal) and 30 s after direct PLCβ stimulation (10 µM m-3M3FBS). (C) Immunofluorescent detection of PLCβ1 and 3; the panel shows representative images from cells detected by confocal microscopy. Neuronal-specific human IIIβ-tubulin (green) and PLCβ1 and 3 (red) were detected in the cells. Nuclei were counterstained with DAPI (blue). The mean fluorescence intensity of the whole cells (D) and of the nuclear zone (E) were compared. Data were expressed as mean ± SEM and compared using the Student’s t-test with Welch’s correction for panels (A,D,E) (* p < 0.05) or with one-way ANOVA and Tukey’s multiple comparisons test for panel (B) (**** p < 0.0001).
Figure 7
Figure 7
Effects of m-3M3FBS on the concentration of IP3 in hONPCs. (A) Cells of HS and SZ patients were stimulated with 10 µM m-3M3FBS for 20 min to activate PLCβ and increase the IP3 concentration. Data were normalized by pg IP3/106 cells and obtained from two technical replicates of four subjects per group. (B) IP3R was directly stimulated with 32 nM ADA. The graphs represent data obtained from eight responses from six subjects per group. Data were expressed as mean ± SEM and compared using the Student’s t-test with Welch’s correction, * p < 0.05.
Figure 8
Figure 8
Increase in cytosolic Ca2+ induced by dopamine and glutamate in single cells of the olfactory epithelium of HS and SZ patients. Changes in intracellular Ca2+ concentration ([Ca2+]i) induced by 10 µM dopamine (A) and 10 µM glutamate (B) by microfluorometry using Fura 2-AM. The graphs represent data obtained from eight responses from six subjects per group. Data were expressed as mean ± SEM and compared using the Student’s t-test with Welch’s correction.

Similar articles

Cited by

References

    1. Jauhar S., Johnstone M., McKenna P.J. Schizophrenia. Lancet. 2022;399:473–486. doi: 10.1016/S0140-6736(21)01730-X. - DOI - PubMed
    1. Stilo S.A., Murray R.M. Non-Genetic Factors in Schizophrenia. Curr. Psychiatry Rep. 2019;21:100. doi: 10.1007/s11920-019-1091-3. - DOI - PMC - PubMed
    1. Howes O.D., Mccutcheon R., Owen M.J., Murray R.M. The Role of Genes, Stress, and Dopamine in the Development of Schizophrenia. Biol. Psychiatry. 2017;81:9–20. doi: 10.1016/j.biopsych.2016.07.014. - DOI - PMC - PubMed
    1. Lewis D.A., Moghaddam B. Cognitive dysfunction in schizophrenia: Convergence of gamma-aminobutyric acid and glutamate alterations. Arch. Neurol. 2006;63:1372–1376. doi: 10.1001/archneur.63.10.1372. - DOI - PubMed
    1. Stahl S.M. Beyond the dopamine hypothesis of schizophrenia to three neural networks of psychosis: Dopamine, serotonin, and glutamate. CNS Spectr. 2018;23:187–191. doi: 10.1017/S1092852918001013. - DOI - PubMed

LinkOut - more resources