. 2024 Oct 20;12(10):2398.
doi: 10.3390/biomedicines12102398.

Three-Dimensional Model Analysis Revealed Differential Cytotoxic Effects of the NK-92 Cell Line and Primary NK Cells on Breast and Ovarian Carcinoma Cell Lines Mediated by Variations in Receptor-Ligand Interactions and Soluble Factor Profiles

Affiliations

Three-Dimensional Model Analysis Revealed Differential Cytotoxic Effects of the NK-92 Cell Line and Primary NK Cells on Breast and Ovarian Carcinoma Cell Lines Mediated by Variations in Receptor-Ligand Interactions and Soluble Factor Profiles

Nadezhda A Alekseeva et al. Biomedicines. .

Abstract

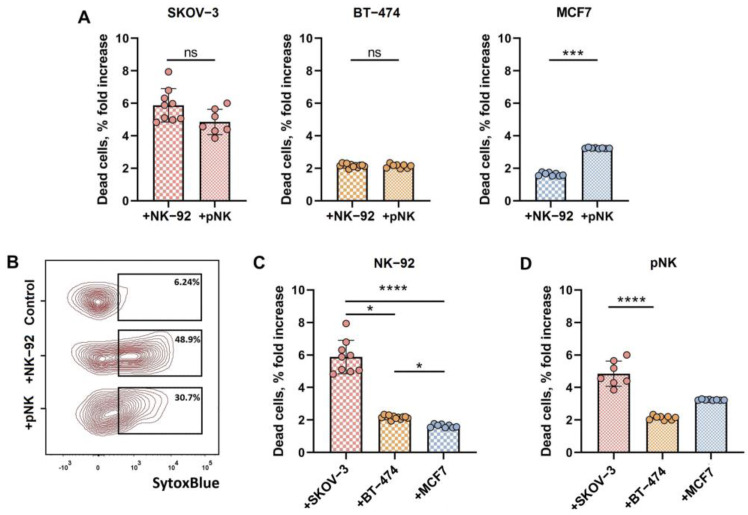
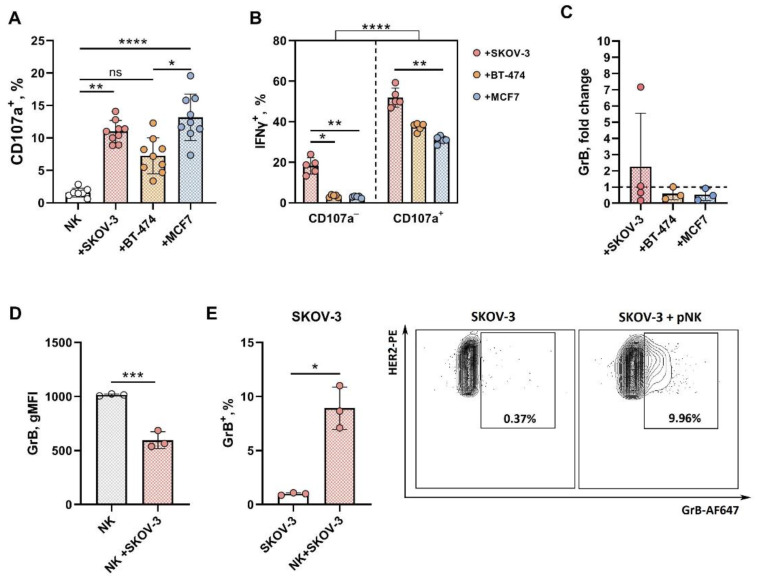
Background/objectives: The functional activity of a certain tumor determines the effectiveness of primary NK cells and NK-92 cell line-based cancer therapy; their therapeutic effectiveness against different tumors can vary. This work provides a direct simultaneous comparison of the cytotoxic effects of in vitro-activated peripheral NK (pNK) cells and NK-92 cells in spheroid models of BT-474, MCF7 and SKOV-3 carcinomas and uncovers the reasons for the differential effectiveness of NK cells against tumors. Methods: Tumor spheroids of similar size and shape, obtained from agarose molds, were incubated with NK-92 or pNK cells for 24 h. Tumor cell death was detected using flow cytometry or confocal microscopy. Cytokine production, granzyme B levels and NK cell degranulation analyses were performed, along with pNK and target-cell phenotypic characterization. Results: While NK-92 and pNK cells lysed BT-474 spheroids with comparably low efficiency, pNK cells were more capable of eliminating MCF7 and SKOV-3 spheroids than NK-92 cells were. The results of the functional and phenotypic analyses strongly support the participation of the NKG2D-NKG2DL pathway in pNK cell activation induced by the most sensitive cytotoxic attack on SKOV-3 spheroids, whereas the CX3CR1-CX3CL1 axis appears to be involved in the pNK reaction against MCF-7 spheroids. Conclusions: We provide a new approach for the preliminary identification of the most promising NK cell receptors that can alter the effectiveness of cancer therapy depending on the specific tumor type. Using this approach, NK-92 cells or pNK subsets can be selected for further accumulation and/or genetic modification to improve specificity and reactivity.

Keywords: NK cells; NK-92; breast cancer; ovarian cancer; tumor spheroids model.


Conflict of interest statement

The authors declare no conflicts of interest. The funders had no role in the design of the study; in the collection, analyses, or interpretation of data; in the writing of the manuscript; or in the decision to publish the results.

Figures

Figure 1
Figure 1
Reduced viability of SKOV-3, BT-474 and MCF7 cells in spheroid models after coculture with NK-92 or pNK cells, measured by flow cytometry. (A) Proportions of dead (SytoxBlue+) cells in the spheroids of SKOV-3, BT-474 and MCF7 cells after coincubation with NK-92 cells compared to those with the pNK effectors. (B) Proportions of dead (SytoxBlue+) cells in the spheroids of SKOV-3 incubated with NK-92 or pNK cells. Representative flow cytometry data. (C) Comparison of the proportions of dead (SytoxBlue+) cells in the spheroids of the SKOV-3, BT-474 and MCF7 cell lines after coincubation with the NK-92 effectors. (D) Comparison of the proportions of dead (SytoxBlue+) cells in the spheroids of SKOV-3, BT-474 and MCF7 cells after coincubation with cells in pNK effector groups. E:T = 3:1 in the presence of 500 U/mL IL-2, incubation time t = 24 h. Statistical analyses were performed using a Mann–Whitney U test (A) or a Kruskal–Wallis multiple comparison test (B,C) (ns—non significant,* p < 0.05, *** p < 0.005, **** p < 0.0001); means ± SDs are shown.
Figure 2
Figure 2
CLSM-based evaluation of the cytotoxic effects of NK-92-GFP and pNK cells on a SKOV-Kat-cell spheroid model. (AC) Representative images of a SKOV-Kat-derived control spheroid (A), a SKOV-Kat spheroid incubated in the presence of NK-92-GFP cells (B) and pNK cells (C) at a ratio of E:T = 3:1. SKOV-Kat cells (red) and SytoxBlue-positive nuclei (blue) are represented via volume rendering (left) or via spots (SKOV-Kat, magenta; SytoxBlue, cyan) (right). The scale bar is 100 µm. The numbers of live cells (Katushka+) (D) and dead cells (SytoxBlue+) (E) were measured in spheroids incubated with (SKOV-Kat + NK-92, SKOV-Kat + pNK) or without effectors (SKOV-Kat). (F) Live cell (Katushka+) proportions in spheroids incubated with NK-92 cells and pNK cells. (G) Dead cell fold increase in the spheroids incubated with NK-92 and pNK cells. Statistical analysis was performed using a Mann–Whitney U test (ns—non significant, ** p < 0.01); the means ± SDs are shown.
Figure 3
Figure 3
Differences in the production of cytokines by NK-92 and pNK cells in response to SKOV-3, BT-474 and MCF7 spheroids. (A) Proportions of IFNγ-positive NK-92 and pNK cells in culture after incubation with SKOV-3, BT-474 and MCF7 spheroids. (B) IFNγ levels in culture supernatants of NK-92 or pNK cells without spheroids (left) or with SKOV-3, BT-474 and MCF7 spheroids (right). (C) TNF levels in culture supernatants of NK-92 or pNK cells without spheroids (left) or with SKOV-3, BT-474 and MCF7 spheroids (right). (D) GM-CSF levels in culture supernatants of NK-92 or pNK cells without spheroids (left) or with SKOV-3, BT-474 and MCF7 spheroids (right). E:T = 3:1, incubation time t = 24 h. Statistical analysis was performed using a Mann–Whitney U test or a Kruskal–Wallis multiple comparison test (* p < 0.05, ** p < 0.01, *** p < 0.005); the means ± SDs are shown.
Figure 4
Figure 4
Cytotoxicity-associated factors in pNK cells in response to the SKOV-3, BT-474 and MCF-7 spheroids. (A) Degranulation activity and (B) intracellular IFNγ content in resting (CD107a) and degranulated (CD107a+) pNK cells. (C) Granzyme B (GrB) accumulation in supernatants after coincubation of pNK cells with tumor spheroids; (D) Intracellular level of GrB in pNK cells (CD56+) alone and after interaction with SKOV-3 spheroids; (E) Intracellular level of GrB in SKOV-3 cells (HER2+, dissociated from spheroids) alone and after interaction with pNK cells. E:T = 3:1, incubation time = 24 h. Statistical analysis was performed using a Mann–Whitney U test or a Kruskal–Wallis multiple comparison test (ns—non significant, * p < 0.05, ** p < 0.01, *** p < 0.005, **** p < 0.0001); the means ± SDs are shown.
Figure 5
Figure 5
Analysis of surface markers related to cytotoxic activity and differentiation stages in total pNK cells and in the fraction of degranulated CD107a+ and resting CD107apNK cells after coincubation with tumor spheroids consisting of BT-474, MCF-7 or SKOV-3 cells. (A,B) Comparison of the proportions of degranulated and nondegranulating NK cells expressing CD16 (A) or KIR2DL2/3 (B). (C) The fold increase in the Tim-3 expression level (gMFI) in pNK cells after coincubation with SKOV-3-, BT-474- and MCF7-derived spheroids compared to that in pNK cells incubated without target cells. The fold change in Tim-3 gMFI in the total pool of pNK cells incubated with spheroids (left) and the fold change in Tim-3 gMFI in the population of degranulated CD107a+ pNK cells (right) are shown. (D) The CX3CR1 expression level (gMFI) in CX3CR1+ pNK cells after coincubation with SKOV-3-, BT-474- and MCF7-derived spheroids compared to that in pNK cells incubated without target cells. CX3CR1 gMFI in the total pool of pNK cells incubated with spheroids (left) and CX3CR1 gMFI in the population of degranulated CD107a+ pNK cells (right). (E) The fold increase in the NKG2D expression level (gMFI) in pNK cells after coincubation with SKOV-3-, BT-474- and MCF7-derived spheroids compared to that in pNK cells incubated without target cells. The fold increase in the NKG2D gMFI in the total pool of pNK cells incubated with spheroids (left) and the fold increase in the NKG2D gMFI in the population of degranulated CD107a+ pNK cells (right) are shown. Each point on the graph is the result of measuring one individual sample. E:T = 3:1, incubation time = 24 h. Statistical analysis was performed using a Kruskal–Wallis multiple comparison test (for (CE)) or a nonparametric Mann–Whitney test (for (A,B)) (* p < 0.05, ** p < 0.01, *** p < 0.005, **** p < 0.0001); the means ± SDs are shown.
Figure 6
Figure 6
Phenotype and cytokine production of spheroids derived from SKOV-3 and BT-474 и MCF-7 cells. (A) Expression analysis of NKG2D ligands (MICA/B, ULBP1, ULBP2/5/6 and ULBP3) in SKOV-3, BT-474 and MCF7 spheroids. Representative flow cytometry data (left) and comparative analysis of NKG2DL expression (right). (B) The expression of Tim-3 ligands (CEACAM1 and galectin-9) and the CX3CR1 ligand (CX3CL1) in SKOV-3, BT-474 and MCF7 spheroid cells; representative cytometry data are shown. (C,D) Multiplex analysis of soluble IL-6 (C) and MCP-1 (D) in supernatants from SKOV-3, BT-474 and MCF-7 spheroids incubated with or without (control) NK-92 or pNK cells. E:T = 3:1, incubation time = 24 h. Statistical analysis was performed using a nonparametric Mann–Whitney U test (* p < 0.05, ** p < 0.01); the means ± SDs are shown.

Similar articles

References

    1. Cooper M.A., Fehniger T.A., Caligiuri M.A. The biology of human natural killer-cell subsets. Trends Immunol. 2001;22:633–640. doi: 10.1016/S1471-4906(01)02060-9. - DOI - PubMed
    1. Shin M.H., Kim J., Lim S.A., Kim J., Kim S.J., Lee K.M. NK Cell-Based Immunotherapies in Cancer. Immune Netw. 2020;20:e14. doi: 10.4110/in.2020.20.e14. - DOI - PMC - PubMed
    1. Xiao J., Zhang T., Gao F., Zhou Z., Shu G., Zou Y., Yin G. Natural Killer Cells: A Promising Kit in the Adoptive Cell Therapy Toolbox. Cancers. 2022;14:5657. doi: 10.3390/cancers14225657. - DOI - PMC - PubMed
    1. Terrén I., Orrantia A., Vitallé J., Zenarruzabeitia O., Borrego F. NK Cell Metabolism and Tumor Microenvironment. Front. Immunol. 2019;10:2278. doi: 10.3389/fimmu.2019.02278. - DOI - PMC - PubMed
    1. Klingemann H. The NK-92 cell line-30 years later: Its impact on natural killer cell research and treatment of cancer. Cytotherapy. 2023;25:451–457. doi: 10.1016/j.jcyt.2022.12.003. - DOI - PubMed

LinkOut - more resources