. 2024 Oct 21;12(10):2410.
doi: 10.3390/biomedicines12102410.

Effects of Angiotensin-I-Converting Enzyme (ACE) Mutations Associated with Alzheimer's Disease on Blood ACE Phenotype

Affiliations

Effects of Angiotensin-I-Converting Enzyme (ACE) Mutations Associated with Alzheimer's Disease on Blood ACE Phenotype

Olga V Kryukova et al. Biomedicines. .

Abstract

Backgrounds: Our recent analysis of 1200+ existing missense ACE mutations revealed that 400+ mutations are damaging and led us to hypothesize that carriers of heterozygous loss-of-function (LoF) ACE mutations (which result in low ACE levels) could be at risk for the development of late-onset Alzheimer's disease (AD).

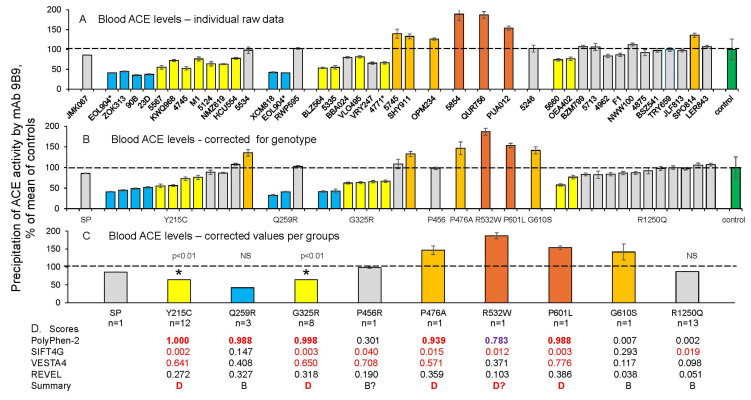
Methods: Here, we quantified blood ACE levels in EDTA plasma from 41 subjects with 10 different heterozygous ACE mutations, as well as 33 controls, and estimated the effect of these mutations on ACE phenotype using a set of mAbs to ACE and two ACE substrates.

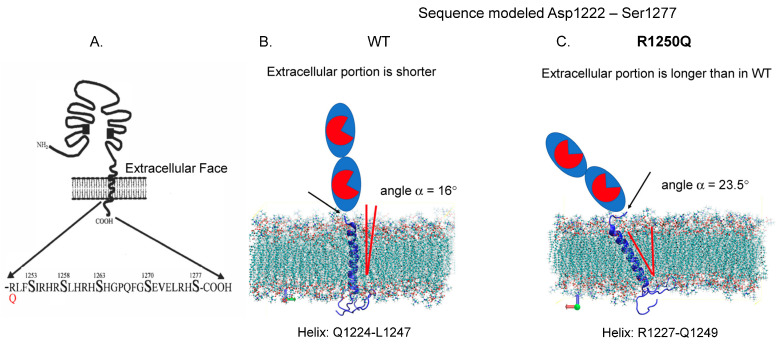
Results: We found that relatively frequent (~1%) AD-associated ACE mutations in the N domain of ACE, Y215C, and G325R are truly damaging and likely transport-deficient, with the ACE levels in plasma at only ~50% of controls. Another AD-associated ACE mutation, R1250Q, in the cytoplasmic tail, did not cause a decrease in ACE and likely did not affect surface ACE expression. We have also developed a method to identify patients with anti-catalytic mutations in the N domain. These mutations may result in reduced degradation of amyloid beta peptide Aβ42, an important component for amyloid deposition. Consequently, these could pose a risk factor for the development of AD.

Conclusions: Therefore, a systematic analysis of blood ACE levels in patients with all ACE mutations has the potential to identify individuals at an increased risk of late-onset AD. These individuals may benefit from future preventive or therapeutic interventions involving a combination of chemical and pharmacological chaperones, as well as proteasome inhibitors, aiming to enhance ACE protein traffic. This approach has been previously demonstrated in our cell model of the transport-deficient ACE mutation Q1069R.

Keywords: Alzheimer’s disease; angiotensin-I-converting enzyme; blood ACE; conformational changes; mutations; screening.


Conflict of interest statement

The authors declare no conflicts of interest. The funders had no role in the design of the study; in the collection, analyses, or interpretation of data; in the writing of the manuscript; or in the decision to publish the results.

Figures

Figure 2
Figure 2
Quantification of blood ACE levels in carriers of ACE mutations. Blood ACE protein was precipitated from EDTA plasma by mAb 9B9 (which binds to an epitope on the N domain of ACE), and its activity was quantified fluorometrically using ZPHL as a substrate. (A) Immunoreactive ACE protein was quantified in plasma samples obtained from 41 carriers of 10 different ACE mutations. Asterisk indicates that ACE from subject 4771 had two mutations. (B) Plasma ACE levels adjusted according to the donor’s genotype for the I/D polymorphism [37,38]. (C) ACE levels (from (B)) were calculated for each group of subjects with the specified ACE mutation; “n” = the number of donors in each group. For carriers of the Y215C, G325R, Q259R, and R1250Q mutations, corresponding median values were calculated and significance analyzed using the Mann–Whitney U test. ACE levels for the other mutations in which only a single subject was available for sampling were presented as the means +/− standard deviations of several independent assessments of those individual samples. Data were expressed as % of ACE levels compared to the corresponding value for the pooled control plasma samples from subjects without ACE mutations (green bars). Orange and brown bars indicate samples with ACE levels higher than 120% and 150% of those of controls, respectively. Yellow and blue bars indicate samples with ACE levels lower than 80% and 50% of those of controls, respectively. Grey bars-values between 80% and 120% from control values. (D) Predictions of the potential damaging effects of nine mutations on the ACE protein using four different predictive tools, derived from Table S1 [15]. Values shown in red are predicted to be damaging by the listed predictive engine; purple-probably damaging, values in black are predicted to be benign. * p < 0.01.
Figure 4
Figure 4
Localization of P476A, P601L, and G610S mutations in the N domain of ACE. Shown is a molecular surface presentation of the crystal structure for the N domain dimer of human ACE, where seven potential Asn glycosylation sites were substituted by Gln residues (PDB 3NXQ). Key amino acids are denoted using somatic ACE numbering. The surface is indicated by light beige, with specific amino acid residues colored as follows: Asn or Asn substituted by Gln in some putative glycosylation sites [36] are highlighted in green; ACE mutations (P476A, P601L, and G610S) are highlighted in magenta. The epitope for mAb5F1 in the N domain was used to test blood samples with these ACE mutations and is marked with a black circle. The interface of dimerization of the N domain [47,48] is shown as a red ellipse, with Y465 marked in bright red.
Figure 6
Figure 6
Localization of Q259R and G325R mutations in the N domain of ACE. Shown is the Cryo-EM structure of the truncated (1–1201) human somatic ACE (PDB 7Q3Y) [35] using molecular surface representation. The coloring is the same as in Figure 1. ACE mutations Q259R and G325R are highlighted with magenta. The epitopes for mAbs in the N domain (5F1/2D1, and 1G12) used to test these blood samples are outlined with black circles.
Figure 7
Figure 7
Localization of AD-associated ACE mutation R1250Q in the cytoplasmic tail. (A) Schema showing the localization of R1250Q ACE mutations in the cytoplasmic tail of ACE, adapted from [53]. (B,C) Molecular dynamic simulations of the transmembrane and cytoplasmic domains of ACE in POPC lipid membranes. The sequence is modeled from position Asp1222 to Ser1277. (B) is the WT helix span from Q1224 to L1247, and (C) is the R1250Q ACE mutant helix span from R1227 to Q1249. The average angles of transmembrane helices in mutant ACEs were changed in the lipid bilayers in comparison with WT ACE (from [15], with permission from publisher).
Figure 1
Figure 1
Localization of relevant ACE mutations in the N domain of ACE. The position of each ACE mutation is shown on the Cryo-EM structure of the truncated (1–1201) human somatic ACE (PDB 7Q3Y) [35] using molecular surface representation. Key amino acids are denoted using somatic ACE numbering. The surface is colored light beige, with specific amino acid residues colored as follows: ACE mutations are highlighted in magenta and additionally marked by arrows; Asn as putative glycosylation sites are highlighted in green; the last visible residue in the C-terminal end of this truncated somatic ACE is marked with its number, S1201. The epitopes for several mAbs to the N domain (9B9, 5F1, i1A8) are shown as black circles for orientation with a diameter of 30 Å, which corresponds to 700 Å2 of the area covered by each listed mAb.
Figure 3
Figure 3
ACE precipitation by mAbs from the EDTA plasma of carriers of ACE mutations. Blood ACE protein was precipitated using two mAbs targeting the N domain (9B9 and 1G12) and mAb2H9, targeting the C domain. Precipitated ACE activity was quantified as in Figure 2. (A) 2H9/9B9 binding ratio; (B) 2H9/1G12 binding ratio; (C) 1G12/9B9 binding ratio. The standard deviations (SDs) for precipitated ACE activity for all three mAbs did not exceed 10%; therefore, their ratios were presented as mean (without individual SD). Bar coloring is the same as in Figure 2.
Figure 5
Figure 5
Effects of different ACE mutations on the catalytic properties of ACEs. Blood ACE protein was precipitated from EDTA plasma using mAb 9B9. Precipitated ACE activity was quantified fluorometrically as in Figure 2, using ZPHL (in (A)) and HHL (in (B)) as substrates. Data in (C) were expressed as a % of the ZPHL/HHL hydrolysis ratio obtained from control samples. Coloring of bars is the same as in Figure 2. Values for the P476A mutant are outlined in the orange box.

Similar articles

References

    1. Selkoe D.J., Hardy J. The amyloid hypothesis of Alzheimer’s disease at 25 years. EMBO Mol. Med. 2016;8:595–608. doi: 10.15252/emmm.201606210. - DOI - PMC - PubMed
    1. Tcw J., Goate A.M. Genetics of β-Amyloid Precursor Protein in Alzheimer’s Disease. Cold Spring Harb. Perspect. Med. 2017;7:a024539. doi: 10.1101/cshperspect.a024539. - DOI - PMC - PubMed
    1. Korovaitseva G.I., Bukina A., Farrer L.A., Rogaev E.I. Presenilin polymorphism in Alzheimer’s disease. Lancet. 1997;350:959. doi: 10.1016/S0140-6736(05)63300-4. - DOI - PubMed
    1. Sims R., Hill M., Williams J. The multiplex model of the genetics of Alzheimer’s disease. Nat. Neurosci. 2020;23:311–322. doi: 10.1038/s41593-020-0599-5. - DOI - PubMed
    1. Andrade-Guerrero J., Santiago-Balmaseda A., Jeronimo-Aguilar P., Vargas-Rodríguez I., Cadena-Suárez A.R., Sánchez-Garibay C., Pozo-Molina G., Méndez-Catalá C.F., Cardenas-Aguayo M.D.C., Diaz-Cintra S., et al. Alzheimer’s Disease: An Updated Overview of Its Genetics. Int. J. Mol. Sci. 2023;24:3754. doi: 10.3390/ijms24043754. - DOI - PMC - PubMed

LinkOut - more resources