

Comparative Transcriptome Analysis of Bovine, Porcine, and Sheep Muscle Using Interpretable Machine Learning Models
- PMID: 39457877
- PMCID: PMC11506101
- DOI: 10.3390/ani14202947
Comparative Transcriptome Analysis of Bovine, Porcine, and Sheep Muscle Using Interpretable Machine Learning Models
Abstract
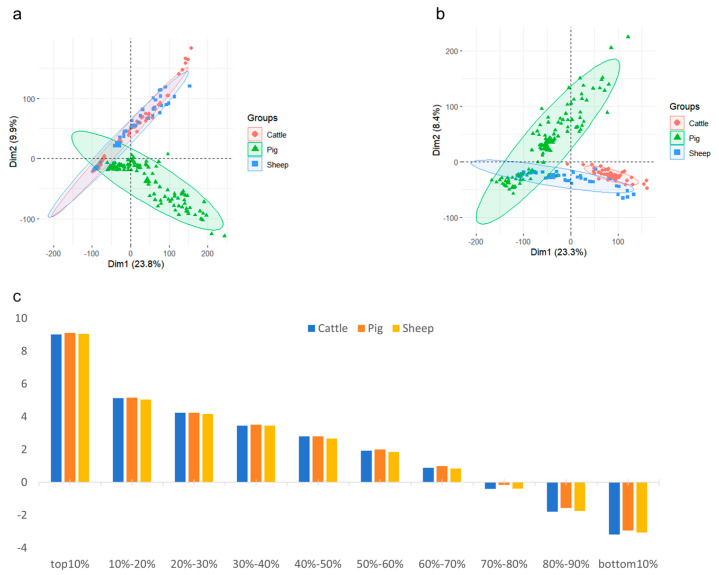
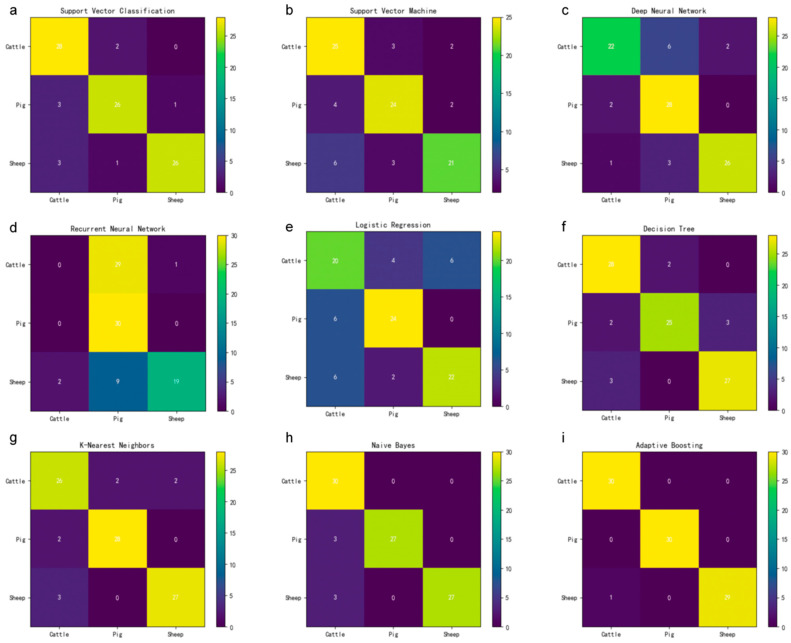
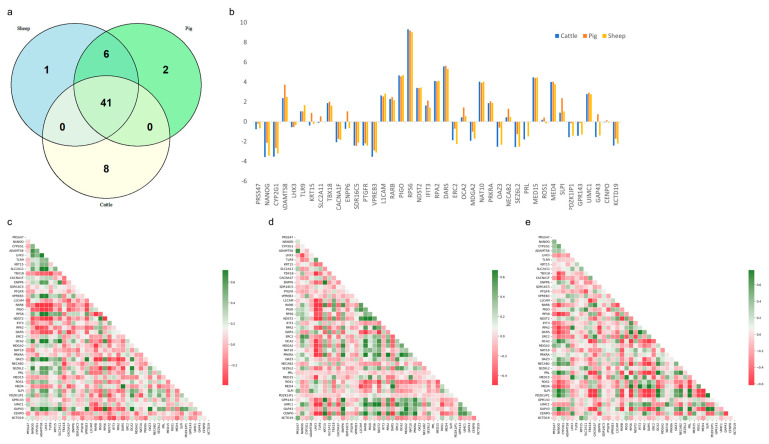
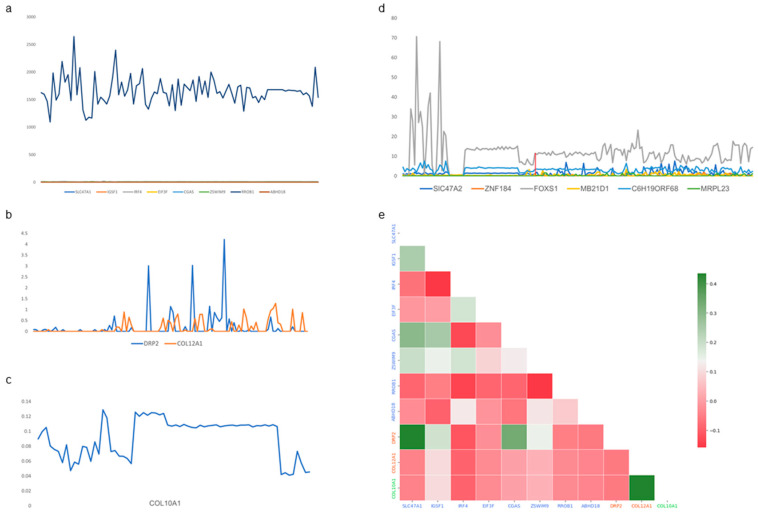
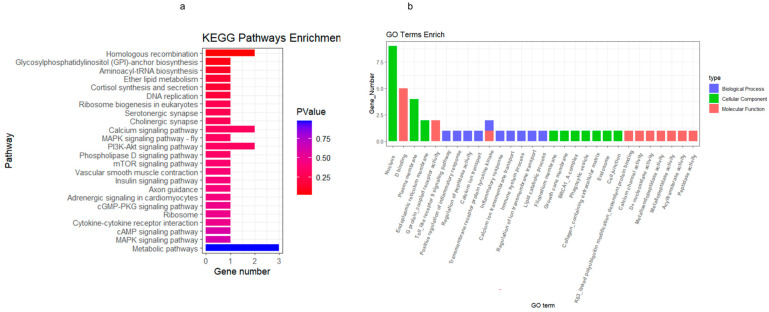
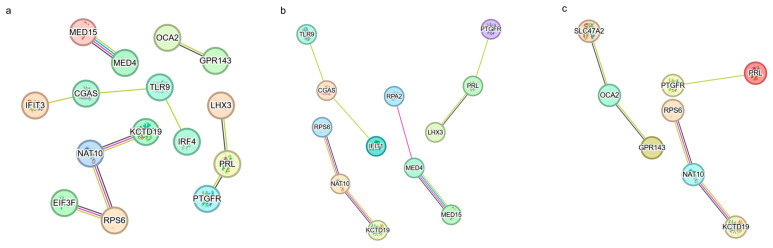
The growth and development of muscle tissue play a pivotal role in the economic value and quality of meat in agricultural animals, garnering close attention from breeders and researchers. The quality and palatability of muscle tissue directly determine the market competitiveness of meat products and the satisfaction of consumers. Therefore, a profound understanding and management of muscle growth is essential for enhancing the overall economic efficiency and product quality of the meat industry. Despite this, systematic research on muscle development-related genes across different species still needs to be improved. This study addresses this gap through extensive cross-species muscle transcriptome analysis, combined with interpretable machine learning models. Utilizing a comprehensive dataset of 275 publicly available transcriptomes derived from porcine, bovine, and ovine muscle tissues, encompassing samples from ten distinct muscle types such as the semimembranosus and longissimus dorsi, this study analyzes 113 porcine (n = 113), 94 bovine (n = 94), and 68 ovine (n = 68) specimens. We employed nine machine learning models, such as Support Vector Classifier (SVC) and Support Vector Machine (SVM). Applying the SHapley Additive exPlanations (SHAP) method, we analyzed the muscle transcriptome data of cattle, pigs, and sheep. The optimal model, adaptive boosting (AdaBoost), identified key genes potentially influencing muscle growth and development across the three species, termed SHAP genes. Among these, 41 genes (including NANOG, ADAMTS8, LHX3, and TLR9) were consistently expressed in all three species, designated as homologous genes. Specific candidate genes for cattle included SLC47A1, IGSF1, IRF4, EIF3F, CGAS, ZSWIM9, RROB1, and ABHD18; for pigs, DRP2 and COL12A1; and for sheep, only COL10A1. Through the analysis of SHAP genes utilizing Kyoto Encyclopedia of Genes and Genomes (KEGG) pathways, relevant pathways such as ether lipid metabolism, cortisol synthesis and secretion, and calcium signaling pathways have been identified, revealing their pivotal roles in muscle growth and development.
Keywords: SHAP; comparative transcriptomics; key genes; machine learning; muscle growth and development.
Conflict of interest statement
This study was conducted in the absence of any commercial or financial relationships that might be perceived as potential conflicts of interest.
Figures
Similar articles
-
Machine Learning-Based Analysis of Differentially Expressed Genes in the Muscle Transcriptome Between Beef Cattle and Dairy Cattle.Int J Mol Sci. 2025 May 23;26(11):5046. doi: 10.3390/ijms26115046. Int J Mol Sci. 2025. PMID: 40507856 Free PMC article.
-
Comprehensive SHAP Values and Single-Cell Sequencing Technology Reveal Key Cell Clusters in Bovine Skeletal Muscle.Int J Mol Sci. 2025 Feb 26;26(5):2054. doi: 10.3390/ijms26052054. Int J Mol Sci. 2025. PMID: 40076676 Free PMC article.
-
Identification of Differentially Expressed Genes in the Longissimus Dorsi Muscle of Luchuan and Duroc Pigs by Transcriptome Sequencing.Genes (Basel). 2023 Jan 3;14(1):132. doi: 10.3390/genes14010132. Genes (Basel). 2023. PMID: 36672873 Free PMC article.
-
RNA-Seq Analysis Identifies Differentially Expressed Genes in the Longissimus dorsi of Wagyu and Chinese Red Steppe Cattle.Int J Mol Sci. 2022 Dec 26;24(1):387. doi: 10.3390/ijms24010387. Int J Mol Sci. 2022. PMID: 36613828 Free PMC article.
-
A deep learning tissue classifier based on differential co-expression genes predicts the pregnancy outcomes of cattle†.Biol Reprod. 2025 Mar 16;112(3):550-562. doi: 10.1093/biolre/ioaf009. Biol Reprod. 2025. PMID: 39832283
Cited by
-
Machine Learning-Based Analysis of Differentially Expressed Genes in the Muscle Transcriptome Between Beef Cattle and Dairy Cattle.Int J Mol Sci. 2025 May 23;26(11):5046. doi: 10.3390/ijms26115046. Int J Mol Sci. 2025. PMID: 40507856 Free PMC article.
-
Machine learning driven multi-omics analysis of the genetic mechanisms behind the double-coat fleece formation in Hetian sheep.Front Genet. 2025 Jun 11;16:1582244. doi: 10.3389/fgene.2025.1582244. eCollection 2025. Front Genet. 2025. PMID: 40567898 Free PMC article.
References
-
- Fitwi M., Tadesse G. Effect of sesame cake supplementation on feed intake, body weight gain, feed conversion efficiency and carcass parameters in the ration of sheep fed on wheat bran and teff (Eragrostis teff) straw. Momona Ethiop. J. Sci. 2013;5:89–106. doi: 10.4314/mejs.v5i1.85333. - DOI
LinkOut - more resources
Full Text Sources
Medical
Research Materials
Miscellaneous
