. 2024 Oct 14;14(20):2959.
doi: 10.3390/ani14202959.

Taurine Protects against Silica Nanoparticle-Induced Apoptosis and Inflammatory Response via Inhibition of Oxidative Stress in Porcine Ovarian Granulosa Cells

Affiliations

Taurine Protects against Silica Nanoparticle-Induced Apoptosis and Inflammatory Response via Inhibition of Oxidative Stress in Porcine Ovarian Granulosa Cells

Fenglei Chen et al. Animals (Basel). .

Abstract

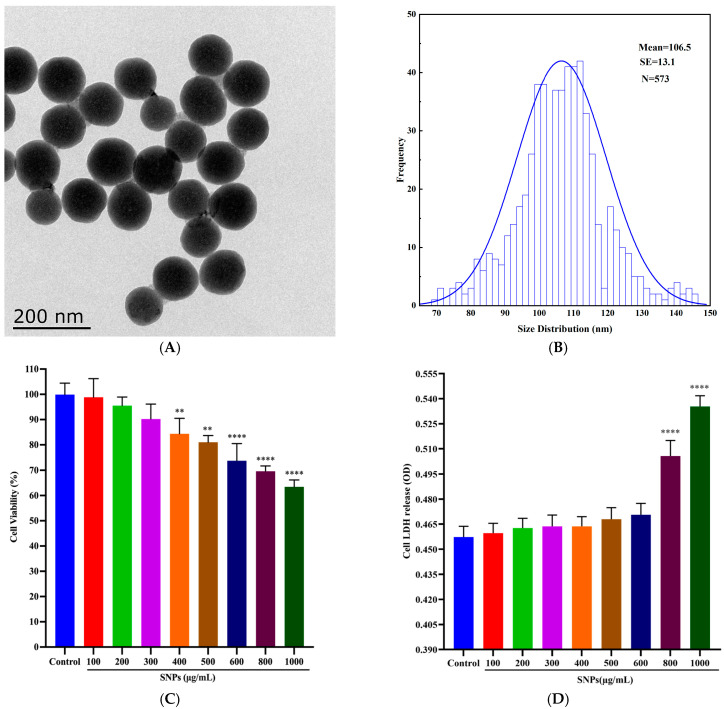
Silica nanoparticles (SNPs) induce reproductive toxicity through ROS production, which significantly limits their application. The protective effects of taurine (Tau) against SNP-induced reproductive toxicity remain unexplored. So this study aims to investigate the impact of Tau on SNP-induced porcine ovarian granulosa cell toxicity. In vitro, granulosa cells were exposed to SNPs combined with Tau. The localization of SNPs was determined by TEM. Cell viability was examined by CCK-8 assay. ROS levels were measured by CLSM and FCM. SOD and CAT levels were evaluated using ELISA and qPCR. Cell apoptosis was detected by FCM, and pro-inflammatory cytokine transcription levels were measured by qPCR. The results showed that SNPs significantly decreased cell viability, while increased cell apoptosis and ROS levels. Moreover, SOD and CAT were decreased, while IFN-α, IFN-β, IL-1β, and IL-6 were increased after SNP exposures. Tau significantly decreased intracellular ROS, while it increased SOD and CAT compared to SNPs alone. Additionally, Tau exhibited anti-inflammatory effects and inhibited cell apoptosis. On the whole, these findings suggest that Tau mitigates SNP-induced cytotoxicity by reducing oxidative stress, inflammatory response, and cell apoptosis. Tau may be an effective strategy to alleviate SNP-induced toxicity and holds promising application prospects in the animal husbandry and veterinary industry.

Keywords: apoptosis; granulosa cells; oxidative stress; silica nanoparticles; taurine.


Conflict of interest statement

The authors declare no conflicts of interest.

Figures

Figure 1
Figure 1
Characteristics and cytotoxicity of SNPs: (A) Representative TEM image of SNPs. (B) Size distribution of SNPs. (C) CCK-8 assay. (D) LDH leakage assay. ** p < 0.01, and **** p < 0.0001 vs. Control.
Figure 2
Figure 2
Cellular uptake and distribution of SNPs in porcine ovarian granulosa cells: (A) Representative TEM image in the control group. The cells were not exposed to SNPs. (B) Zoomed-in image of the white box in (A). (C) Zoomed-in image of the black box in (B). (D) Representative TEM image in the SNP-exposed group. The cells were exposed to 400 μg/mL SNPs for 48 h. (E) Zoomed-in image of the white box in (D). (F) Zoomed-in image of the black box in (E). Black arrows indicate vesicles in the cytoplasm and white arrows indicate SNPs. Scale bar, 5 μm (A,D), 2 μm (B,E), and 1 μm (C,F).
Figure 3
Figure 3
SNP-induced oxidative stress in porcine ovarian granulosa cells. (A) Representative images of ROS staining by CLSM. Ovarian granulosa cells were exposed to control (a), 200 (b), 400 (c), and 800 (d) μg/mL SNPs for 48 h. Green indicates fluorescence of ROS and blue indicates the nucleus of ovarian granulosa cells. Scale bar, 30 μm. (B) Quantitative analysis of the intracellular ROS levels by FCM. (C) Corresponding analysis of fluorescence intensity in Figure (B). (D) Quantitative analysis of CAT mRNA levels by qPCR. (E) Quantitative analysis of SOD mRNA levels by qPCR. (F) Quantitative analysis of CAT enzyme activity by ELISA. (G) Quantitative analysis of SOD enzyme activity by ELISA. * p < 0.05, ** p < 0.01, and *** p < 0.001 vs. Control.
Figure 3
Figure 3
SNP-induced oxidative stress in porcine ovarian granulosa cells. (A) Representative images of ROS staining by CLSM. Ovarian granulosa cells were exposed to control (a), 200 (b), 400 (c), and 800 (d) μg/mL SNPs for 48 h. Green indicates fluorescence of ROS and blue indicates the nucleus of ovarian granulosa cells. Scale bar, 30 μm. (B) Quantitative analysis of the intracellular ROS levels by FCM. (C) Corresponding analysis of fluorescence intensity in Figure (B). (D) Quantitative analysis of CAT mRNA levels by qPCR. (E) Quantitative analysis of SOD mRNA levels by qPCR. (F) Quantitative analysis of CAT enzyme activity by ELISA. (G) Quantitative analysis of SOD enzyme activity by ELISA. * p < 0.05, ** p < 0.01, and *** p < 0.001 vs. Control.
Figure 4
Figure 4
SNP-activated inflammatory response in porcine ovarian granulosa cells: (AD) Quantitative analysis of the mRNA levels for IFN-α (A), IFN-β (B), IL-1β (C), and IL-6 (D) by qPCR. * p < 0.05 and *** p < 0.001 vs. Control.
Figure 5
Figure 5
Cell apoptosis was activated in porcine ovarian granulosa cells after SNP exposures: (A) The apoptotic rate was determined by FCM. Q1-UL quadrant represents cell death caused by mechanical damage or necrotic cells, Q1-UR quadrant represents late apoptotic cells, Q1-LL quadrant represents the normal cells, and Q1-LR quadrant represents early apoptotic cells. (B) Quantification of the apoptotic rate. (CF) Quantitative analysis of the mRNA levels for BCL-2 (C), BAX (D), Caspase-3 (E), and PARP (F) by qPCR. (G) Detection of BCL-2, BAX, cleaved Caspase-3, and cleaved PARP expressions by Western Blot. (H) Quantitative analysis of the band intensity for BCL-2, BAX, cleaved Caspase-3, and cleaved PARP. * p < 0.05, ** p < 0.01, and *** p < 0.001 vs. Control.
Figure 5
Figure 5
Cell apoptosis was activated in porcine ovarian granulosa cells after SNP exposures: (A) The apoptotic rate was determined by FCM. Q1-UL quadrant represents cell death caused by mechanical damage or necrotic cells, Q1-UR quadrant represents late apoptotic cells, Q1-LL quadrant represents the normal cells, and Q1-LR quadrant represents early apoptotic cells. (B) Quantification of the apoptotic rate. (CF) Quantitative analysis of the mRNA levels for BCL-2 (C), BAX (D), Caspase-3 (E), and PARP (F) by qPCR. (G) Detection of BCL-2, BAX, cleaved Caspase-3, and cleaved PARP expressions by Western Blot. (H) Quantitative analysis of the band intensity for BCL-2, BAX, cleaved Caspase-3, and cleaved PARP. * p < 0.05, ** p < 0.01, and *** p < 0.001 vs. Control.
Figure 6
Figure 6
Tau inhibited SNP-induced oxidative stress in porcine ovarian granulosa cells. Ovarian granulosa cells were exposed to SNPs in the absence or presence of 10 mM Tau for 48 h: (A) Representative images of ROS staining by CLSM. Ovarian granulosa cells were exposed to control (a), 200 μg/mL SNP group (b), 400 μg/mL SNP (c), 800 μg/mL SNP (d), 10 mM Tau (e), 200 μg/mL SNP combined with 10 mM Tau (f), 400 μg/mL SNP combined with 10 mM Tau (g), and 800 μg/mL SNP combined with 10 mM Tau (h). Green indicates fluorescence of ROS and blue indicates the nucleus of ovarian granulosa cells. Scale bar, 30 μm. (B) Quantitative analysis of the intracellular ROS levels by FACS. (C) Corresponding analysis of the fluorescence intensity in Figure (B). (D) Quantitative analysis of CAT mRNA levels by qPCR. (E) Quantitative analysis of SOD mRNA levels by qPCR. (F) Quantitative analysis of CAT enzyme activity by ELISA. (G) Quantitative analysis of SOD enzyme activity by ELISA. * p < 0.05, ** p < 0.01, and *** p < 0.001 vs. Control. # p < 0.05 and ## p < 0.01 vs. SNP-exposed group.
Figure 6
Figure 6
Tau inhibited SNP-induced oxidative stress in porcine ovarian granulosa cells. Ovarian granulosa cells were exposed to SNPs in the absence or presence of 10 mM Tau for 48 h: (A) Representative images of ROS staining by CLSM. Ovarian granulosa cells were exposed to control (a), 200 μg/mL SNP group (b), 400 μg/mL SNP (c), 800 μg/mL SNP (d), 10 mM Tau (e), 200 μg/mL SNP combined with 10 mM Tau (f), 400 μg/mL SNP combined with 10 mM Tau (g), and 800 μg/mL SNP combined with 10 mM Tau (h). Green indicates fluorescence of ROS and blue indicates the nucleus of ovarian granulosa cells. Scale bar, 30 μm. (B) Quantitative analysis of the intracellular ROS levels by FACS. (C) Corresponding analysis of the fluorescence intensity in Figure (B). (D) Quantitative analysis of CAT mRNA levels by qPCR. (E) Quantitative analysis of SOD mRNA levels by qPCR. (F) Quantitative analysis of CAT enzyme activity by ELISA. (G) Quantitative analysis of SOD enzyme activity by ELISA. * p < 0.05, ** p < 0.01, and *** p < 0.001 vs. Control. # p < 0.05 and ## p < 0.01 vs. SNP-exposed group.
Figure 7
Figure 7
Tau inhibited SNP-activated inflammatory response in porcine ovarian granulosa cells. Ovarian granulosa cells were exposed to SNPs in the absence or presence of 10 mM Tau for 48 h: (AD) Quantitative analysis of the mRNA levels for IFN-α (A), IFN-β (B), IL-1β (C), and IL-6 (D) by qPCR. * p < 0.05, ** p < 0.01, and *** p < 0.001 vs. Control. # p < 0.05, ## p < 0.01, and ### p < 0.001 vs. SNP-exposed group.
Figure 7
Figure 7
Tau inhibited SNP-activated inflammatory response in porcine ovarian granulosa cells. Ovarian granulosa cells were exposed to SNPs in the absence or presence of 10 mM Tau for 48 h: (AD) Quantitative analysis of the mRNA levels for IFN-α (A), IFN-β (B), IL-1β (C), and IL-6 (D) by qPCR. * p < 0.05, ** p < 0.01, and *** p < 0.001 vs. Control. # p < 0.05, ## p < 0.01, and ### p < 0.001 vs. SNP-exposed group.
Figure 8
Figure 8
Tau inhibited SNP-induced cell apoptosis in porcine ovarian granulosa cells. Ovarian granulosa cells were exposed to SNPs in the absence or presence of 10 mM Tau for 48 h: (A) The apoptotic rate was determined by FCM. Q1-UL quadrant represents cell death caused by mechanical damage or necrotic cells, Q1-UR quadrant represents late apoptotic cells, Q1-LL quadrant represents the normal cells, and Q1-LR quadrant represents early apoptotic cells. (B) Quantification of the apoptotic rate. (B) Quantification of the apoptotic rate. (CF) Quantitative analysis of the mRNA levels for BCL-2 (C), BAX (D), Caspase-3 (E), and PARP (F) by qPCR. (G) Detection of BCL-2, BAX, cleaved Caspase-3, and cleaved PARP expressions by Western Blot. (H) Quantitative analysis of the band intensity for BCL-2, BAX, cleaved Caspase-3, and cleaved PARP. * p < 0.05, ** p < 0.01, and *** p < 0.001 vs. Control. # p < 0.05, ## p < 0.01, and ### p < 0.001 vs. SNP-exposed group.
Figure 8
Figure 8
Tau inhibited SNP-induced cell apoptosis in porcine ovarian granulosa cells. Ovarian granulosa cells were exposed to SNPs in the absence or presence of 10 mM Tau for 48 h: (A) The apoptotic rate was determined by FCM. Q1-UL quadrant represents cell death caused by mechanical damage or necrotic cells, Q1-UR quadrant represents late apoptotic cells, Q1-LL quadrant represents the normal cells, and Q1-LR quadrant represents early apoptotic cells. (B) Quantification of the apoptotic rate. (B) Quantification of the apoptotic rate. (CF) Quantitative analysis of the mRNA levels for BCL-2 (C), BAX (D), Caspase-3 (E), and PARP (F) by qPCR. (G) Detection of BCL-2, BAX, cleaved Caspase-3, and cleaved PARP expressions by Western Blot. (H) Quantitative analysis of the band intensity for BCL-2, BAX, cleaved Caspase-3, and cleaved PARP. * p < 0.05, ** p < 0.01, and *** p < 0.001 vs. Control. # p < 0.05, ## p < 0.01, and ### p < 0.001 vs. SNP-exposed group.

Similar articles

References

    1. Jiang H.H., Zhang L., Wang X.J., Gu J., Song Z.L., Wei S.M., Guo H.H., Xu L., Qian X. Reductions in abundances of intracellular and extracellular antibiotic resistance genes by SiO2 nanoparticles during composting driven by mobile genetic elements. J. Environ. Manag. 2023;341:118071. doi: 10.1016/j.jenvman.2023.118071. - DOI - PubMed
    1. Li Y., Chen X., Jin R.H., Chen L., Dang M., Cao H., Dong Y., Cai B.L., Bai G., Gooding J.J., et al. Injectable hydrogel with MSNs/microRNA-21-5p delivery enables both immunomodification and enhanced angiogenesis for myocardial infarction therapy in pigs. Sci. Adv. 2021;7:eabd6740. doi: 10.1126/sciadv.abd6740. - DOI - PMC - PubMed
    1. Ferreira G.C., Sanches T.V.C., Mechler-Dreibi M.L., Almeida H.M.S., Storino G.Y., Sonalio K., Petri F.A.M., Martins T.S., da Silva L.C.C., Montassier H.J., et al. Efficacy evaluation of a novel oral silica-based vaccine in inducing mucosal immunity against Mycoplasma hyopneumoniae. Res. Vet. Sci. 2023;158:141–150. doi: 10.1016/j.rvsc.2023.03.018. - DOI - PubMed
    1. Ru J.X., Chen Y., Tao S.Y., Du S.B., Liang C., Teng Z.D., Gao Y. Exploring hollow mesoporous silica nanoparticles as a nanocarrier in the delivery of foot-and-mouth disease virus-like particle vaccines. ACS Appl. Bio Mater. 2024;7:1064–1072. doi: 10.1021/acsabm.3c01015. - DOI - PubMed
    1. He J., Zhu T.Y., Mao N.N., Cai G.F., Gu P.F., Song Z.C., Lu X.Q., Yang Y., Wang D.Y. Cistanche deserticola polysaccharide-functionalized dendritic fibrous nano-silica as oral vaccine adjuvant delivery enhancing both the mucosal and systemic immunity. Int. J. Biol. Macromol. 2024;262:129982. doi: 10.1016/j.ijbiomac.2024.129982. - DOI - PubMed

LinkOut - more resources