

Extreme-Phenotype Genome-Wide Association Analysis for Growth Traits in Spotted Sea Bass (Lateolabrax maculatus) Using Whole-Genome Resequencing
- PMID: 39457925
- PMCID: PMC11503831
- DOI: 10.3390/ani14202995
Extreme-Phenotype Genome-Wide Association Analysis for Growth Traits in Spotted Sea Bass (Lateolabrax maculatus) Using Whole-Genome Resequencing
Abstract
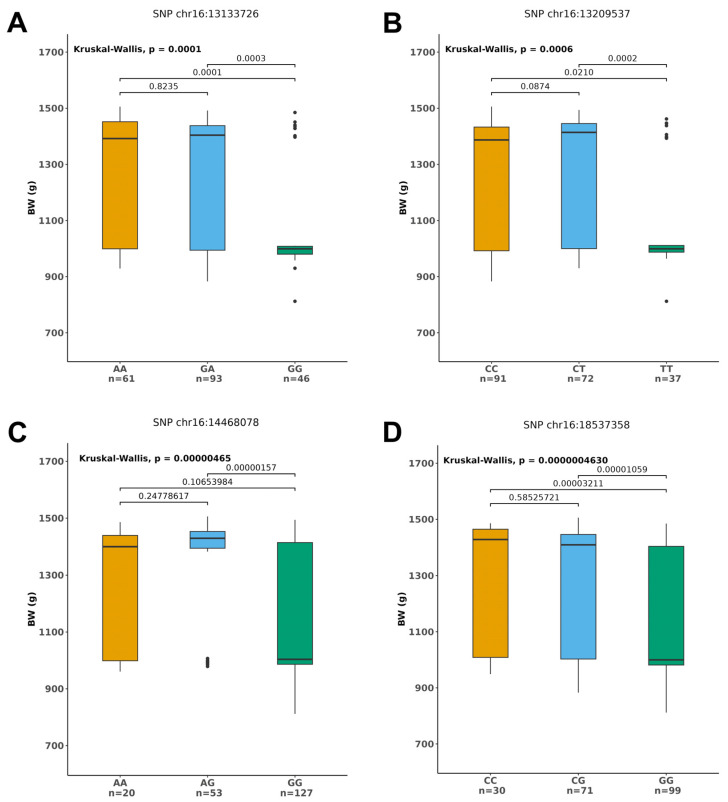
Spotted sea bass (Lateolabrax maculatus) is an important marine economic fish in China, ranking third in annual production among marine fish. However, a declined growth rate caused by germplasm degradation has severely increased production costs and reduced economic benefits. There is an urgent need to develop the fast-growing varieties of L. maculatus and elucidate the genetic mechanisms underlying growth traits. Here, whole-genome resequencing technology combined with extreme phenotype genome-wide association analysis (XP-GWAS) was used to identify candidate markers and genes associated with growth traits in L. maculatus. Two groups of L. maculatus, consisting of 100 fast-growing and 100 slow-growing individuals with significant differences in body weight, body length, and carcass weight, underwent whole-genome resequencing. A total of 4,528,936 high-quality single nucleotide polymorphisms (SNPs) were used for XP-GWAS. These SNPs were evenly distributed across all chromosomes without large gaps, and the average distance between SNPs was only 175.8 bp. XP-GWAS based on the Bayesian-information and Linkage-disequilibrium Iteratively Nested Keyway (Blink) and Fixed and random model Circulating Probability Unification (FarmCPU) identified 50 growth-related markers, of which 17 were related to body length, 19 to body weight, and 23 to carcass weight. The highest phenotypic variance explained (PVE) reached 15.82%. Furthermore, significant differences were observed in body weight, body length, and carcass weight among individuals with different genotypes. For example, there were highly significant differences in body weight among individuals with different genotypes for four SNPs located on chromosome 16: chr16:13133726, chr16:13209537, chr16:14468078, and chr16:18537358. Additionally, 47 growth-associated genes were annotated. These genes are mainly related to the metabolism of energy, glucose, and lipids and the development of musculoskeletal and nervous systems, which may regulate the growth of L. maculatus. Our study identified growth-related markers and candidate genes, which will help to develop the fast-growing varieties of L. maculatus through marker-assisted breeding and elucidate the genetic mechanisms underlying the growth traits.
Keywords: Lateolabrax maculatus; genome-wide association analysis; growth traits; whole genome resequencing.
Conflict of interest statement
The authors declare no conflicts of interest.
Figures


Similar articles
-
First High-Density Linkage Map and QTL Fine Mapping for Growth-Related Traits of Spotted Sea bass (Lateolabrax maculatus).Mar Biotechnol (NY). 2020 Aug;22(4):526-538. doi: 10.1007/s10126-020-09973-4. Epub 2020 May 19. Mar Biotechnol (NY). 2020. PMID: 32424479
-
Molecular Cloning, Screening of Single Nucleotide Polymorphisms, and Analysis of Growth-Associated Traits of igf2 in Spotted Sea Bass (Lateolabrax maculatus).Animals (Basel). 2023 Mar 8;13(6):982. doi: 10.3390/ani13060982. Animals (Basel). 2023. PMID: 36978523 Free PMC article.
-
Genetic Basis and Identification of Candidate Genes for Alkalinity Tolerance Trait in Spotted Sea Bass (Lateolabrax maculatus) by Genome-Wide Association Study (GWAS).Mar Biotechnol (NY). 2025 Jan 9;27(1):27. doi: 10.1007/s10126-024-10405-w. Mar Biotechnol (NY). 2025. PMID: 39786505
-
Whole genome and transcriptome analyses identify genetic markers associated with growth traits in Qinchuan black pig.BMC Genomics. 2025 May 12;26(1):469. doi: 10.1186/s12864-025-11627-5. BMC Genomics. 2025. PMID: 40355827 Free PMC article.
-
Chromosome-level genome assembly of the spotted sea bass, Lateolabrax maculatus.Gigascience. 2018 Nov 1;7(11):giy114. doi: 10.1093/gigascience/giy114. Gigascience. 2018. PMID: 30239684 Free PMC article.
Cited by
-
Genome-Wide Association Study for Weight-Related Traits in Scylla paramamosain Using Whole-Genome Resequencing.Animals (Basel). 2025 Jun 20;15(13):1829. doi: 10.3390/ani15131829. Animals (Basel). 2025. PMID: 40646730 Free PMC article.
References
-
- Ministry of Agriculture and Rural Affairs. National Fisheries Technology Extension Center. China Society of Fisheries . China Fishery Statistical Yearbook. China Agriculture Press; Beijing, China: 2024.
-
- Zhang C., Wen H., Zhang Y., Zhang K., Qi X., Li Y. First genome-wide association study and genomic prediction for growth traits in spotted sea bass (Lateolabrax maculatus) using whole-genome resequencing. Aquaculture. 2023;566:739194. doi: 10.1016/j.aquaculture.2022.739194. - DOI
Grants and funding
LinkOut - more resources
Full Text Sources
