. 2024 Oct 12;13(20):6081.
doi: 10.3390/jcm13206081.

Targeting KDM1A in Neuroblastoma with NCL-1 Induces a Less Aggressive Phenotype and Suppresses Angiogenesis

Affiliations

Targeting KDM1A in Neuroblastoma with NCL-1 Induces a Less Aggressive Phenotype and Suppresses Angiogenesis

Annika Sprüssel et al. J Clin Med. .

Abstract

Background: The KDM1A histone demethylase regulates the cellular balance between proliferation and differentiation, and is often deregulated in human cancers including the childhood tumor neuroblastoma. We previously showed that KDM1A is strongly expressed in undifferentiated neuroblastomas and correlates with poor patient prognosis, suggesting a possible clinical benefit from targeting KDM1A. Methods: Here, we tested the efficacy of NCL-1, a small molecule specifically inhibiting KDM1A in preclinical models for neuroblastoma. Results: NCL-1 mimicked the effects of siRNA-mediated KDM1A knockdown and effectively inhibited KDM1A activity in four neuroblastoma cell lines and a patient-representative cell model. KDM1A inhibition shifted the aggressive tumor cell phenotypes towards less aggressive phenotypes. The proliferation and cell viability was reduced, accompanied by the induction of markers of neuronal differentiation. Interventional NCL-1 treatment of nude mice harboring established neuroblastoma xenograft tumors reduced tumor growth and inhibited cell proliferation. Reduced vessel density and defects in blood vessel construction also resulted, and NCL-1 inhibited the growth and tube formation of HUVEC-C cells in vitro. Conclusions: Inhibiting KDM1A could attack aggressive neuroblastomas two-fold, by re-directing tumor cells toward a less aggressive, slower-growing phenotype and by preventing or reducing the vascular support of large tumors.

Keywords: LSD1; epigenetics; histone demethylase; pediatric cancer; targeted therapy.


Conflict of interest statement

The authors declare no potential conflicts of interest.

Figures

Figure 1
Figure 1
NCL-1 efficiently suppresses neuroblastoma cell viability in vitro and inhibits KDM1A-mediated histone demethylation. (A). The effective dose of NCL-1 required to inhibit cell viability by 50% (EC50) was calculated for the human neuroblastoma cell lines SH-EP, SK N BE, SK-N-AS, and IMR-5. The EC50 and the inhibitory concentration (IC50) values were identical. Cell viability was assessed using the MTT assay after treatment with 5–80 µM NCL-1 for 72 h. Treatment with the solvent (DMSO) alone served as the control. (B) Whole-cell lysates were prepared in RIPA buffer from cultures treated with 40 µM NCL-1 or DMSO (control) for 24 h and 72 h, then sonicated to disrupt protein complexes. Relative KDM1A activity was analyzed using the EpiQuik™ KDM1A/LSD1 activity/inhibition assay. Significant differences between treatment groups were assessed by Student’s t-test. All comparisons between treatment groups and the corresponding controls had p-values < 0.001. *** p < 0.0001.
Figure 2
Figure 2
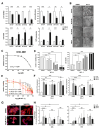
KDM1A inhibition with NCL-1 mimics functional effects of KDM1A knockdown in vitro. (A). Neuroblastoma cell lines were treated for 72 h with 40 µM NCL-1. Cell viability was assessed in MTT assays, cell proliferation in an ELISA (BrdU integration), cell death in the Cell Death ELISA, and NTS expression by qPCR. (B). Outgrowing neurites are indicated by black arrowheads in micrographs of cultures treated with 40µM NCL-1 or DMSO (control). Scale bars: 50 µm. (C). Cell viability (CellTiter-Glo® Luminescent Cell Viability Assay) was used to assess effective dose of NCL-1 required to inhibit 50% activity (EC50) in the OHC-NB1 model at 72 h. The EC50 and the inhibitory concentration (IC50) values were identical. Treatment with DMSO alone served as the control. (D). OHC-NB1 model viability and cell death after 72 h NCL-1 treatment relative to controls (DMSO) are presented as bar graphs. (E). The effective dose of NCL-1 required to inhibit SK N BE cell viability by 50% (EC50) at 72 h was calculated for treatment with NCL 1 alone or in combination with the indicated retinoic acid (RA) doses. The EC50 and the inhibitory concentration (IC50) values were identical. The effects of combination treatment with retinoic acid (RA) or NCL 1 alone in SK-N-BE cells on markers of differentiation are shown as bar graphs for relative NTS and MAP2 expression (qPCR) after 24 h (F), filamentous cytoskeletal actin by phalloidin staining in representative micrographs after 72 h (G) and bar graphs of total numbers of neurite-like structures visible per cell in 125 randomly selected fields after both 24 h and 72 h (H). The fold-changes in every treatment group were compared to those in the DMSO control (also without retinoic acid = 1). Significant differences between treatment groups were analyzed using Student’s t-test (* p < 0.05, ** p < 0.01, *** p < 0.001).
Figure 3
Figure 3
NCL-1 treatment suppresses growth of neuroblastoma xenograft tumors in mice. Xenograft tumors were generated prior to treatment from SK-N-BE and SK-N-AS cells grafted subcutaneously in NMRI nu/nu mice. Mice were intraperitoneally injected once daily with 5 mg NCL-1 in adjuvant (SK-N-AS: 10 mice, SK-N-BE: 5 mice) or adjuvant alone (SK-N-AS: 11 mice, SK-N-BE: 5 mice) as a control for 14 d. Additionally, 3 mice each engrafted with either cell line were treated for 3 d twice daily with 10 mg NCL-1. (A). Tumor volumes were measured using calipers, and tumor growth curves were generated using mean tumor volumes from each treatment group on each treatment day. Significant differences between treatment groups were analyzed using Student’s t-test (* p < 0.05, ** p < 0.01, *** p < 0.001). (B). Box and whisker plots represent final tumor volumes after 14 d of treatment. (C). Representative pictures are shown for SK-N-AS tumors from mice treated for 3 d. Tumor histology is shown with hematoxylin/eosin (HE) staining, and proliferating (MKI67) and apoptotic (cleaved CASP3) cells were immunohistochemically detected. Scale bars: 100 µm. (D). Representative pictures of PECAM1 staining in SK-N-AS tumors from mice treated for 14 d with NCL-1 or adjuvant control are shown. Scale bars: 50 µm. Vessels are indicated by asterisks and single groups of erythrocytes by arrows. (E). Blood vessels were counted in 8–12 random fields from PECAM1-stained sections from SK-N-BE and SK-N-AS xenograft tumors after 14 d of NCL-1 (or adjuvant control) treatment. (F). Numbers of vessels with endothelial cells (PECAM1-positive) were calculated for the same images as (E) and are shown relative to the adjuvant control. (G). After 14 d of treatment, hypoxic regions were stained by HIF1A enrichment in tumor border, stroma, and central islands of the tumor. Scale bars: 100 µm. (H). Representative histology in SK-N-BE xenografts (hematoxylin/eosin staining) after 14 d of NCL-1 or adjuvant control. Scale bars: 20 µm. (I). NTS and MAP2 expression (qPCR) is shown for the same SK-N-BE xenograft tumors shown in H. Significant differences between treatment groups were assessed by Student’s t-test (** p < 0.01, *** p < 0.001).
Figure 4
Figure 4
Inhibiting KDM1A in HUVEC-C cells in vitro disrupts angiogenic activities. (A). Whole-cell lysates were prepared from HUVEC-C and neuroblastoma cell lines in RIPA buffer with sonication to disrupt protein complexes and separated on 15% SDS-PAGE. Basal KDM1A protein expression was detected by Western blotting. HUVEC-C cells were treated with 40 µM NCL-1 or DMSO (control) for 72 h, then relative KDM1A activity was assessed using the EpiQuik™ KDM1A/LSD1 activity/inhibition assay (B), cell viability was assessed in MTT assays (C), cell proliferation was assessed in an ELISA for BrdU incorporation in DNA (D) and cell death was assessed in the Cell Death ELISA (E,F). Wound healing was analyzed by scratch assay, with representative pictures of scratch growing after 30 h of treatment. Scale bars: 50 µm. (G). Representative pictures are shown of HUVEC-C cells in tube formation assays after 8 h of treatment with NCL-1 or DMSO (control). Scale bars: 100 µm. (H). Mean tube length and mesh size were calculated for tubes formed after 24 h in the presence of NCL-1 or DMSO (control). Significant differences between treatment groups were assessed by Student’s t-test (* p < 0.05, ** p < 0.01, *** p < 0.001).

References

    1. Whittle S.B., Smith V., Doherty E., Zhao S., McCarty S., Zage P.E. Overview and recent advances in the treatment of neuroblastoma. Expert Rev. Anticancer Ther. 2017;17:369–386. doi: 10.1080/14737140.2017.1285230. - DOI - PubMed
    1. Simon T., Hero B., Schulte J.H., Deubzer H., Hundsdoerfer P., von Schweinitz D., Fuchs J., Schmidt M., Prasad V., Krug B., et al. 2017 GPOH Guidelines for Diagnosis and Treatment of Patients with Neuroblastic Tumors. Klin. Pädiatrie. 2017;229:147–167. doi: 10.1055/s-0043-103086. - DOI - PubMed
    1. Maris J.M. Recent advances in neuroblastoma. N. Engl. J. Med. 2010;362:2202–2211. doi: 10.1056/NEJMra0804577. - DOI - PMC - PubMed
    1. Shi Y., Lan F., Matson C., Mulligan P., Whetstine J.R., Cole P.A., Casero R.A., Shi Y. Histone demethylation mediated by the nuclear amine oxidase homolog LSD1. Cell. 2004;119:941–953. doi: 10.1016/j.cell.2004.12.012. - DOI - PubMed
    1. Maiques-Diaz A., Somervaille T.C. LSD1: Biologic roles and therapeutic targeting. Epigenomics. 2016;8:1103–1116. doi: 10.2217/epi-2016-0009. - DOI - PMC - PubMed

LinkOut - more resources