. 2024 Sep 30;12(10):2000.
doi: 10.3390/microorganisms12102000.

It Takes Two to Make a Thing Go Right: Epistasis, Two-Component Response Systems, and Bacterial Adaptation

Affiliations

It Takes Two to Make a Thing Go Right: Epistasis, Two-Component Response Systems, and Bacterial Adaptation

Brittany R Sanders et al. Microorganisms. .

Abstract

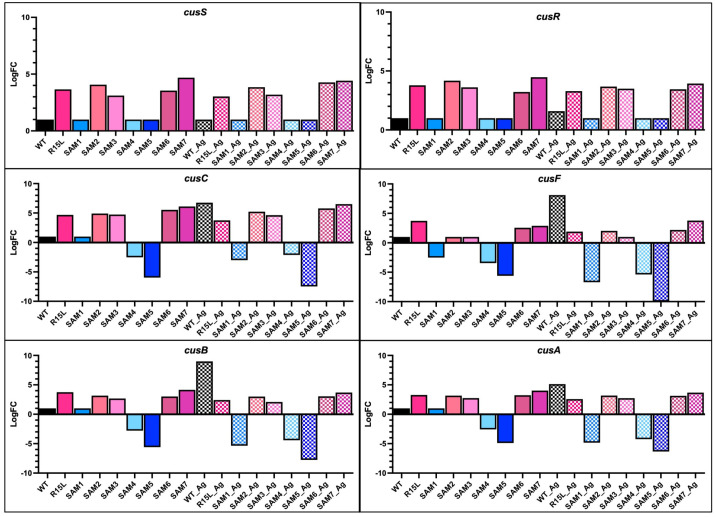
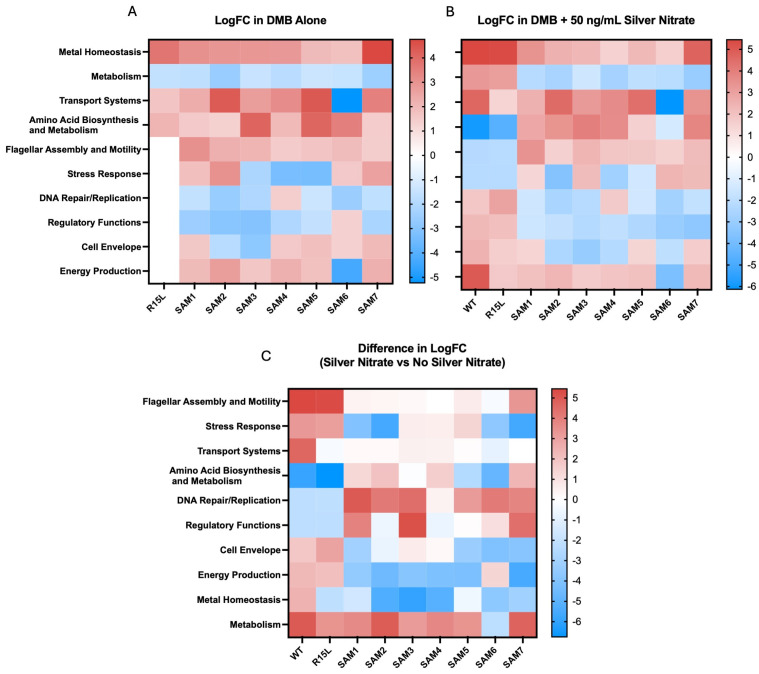
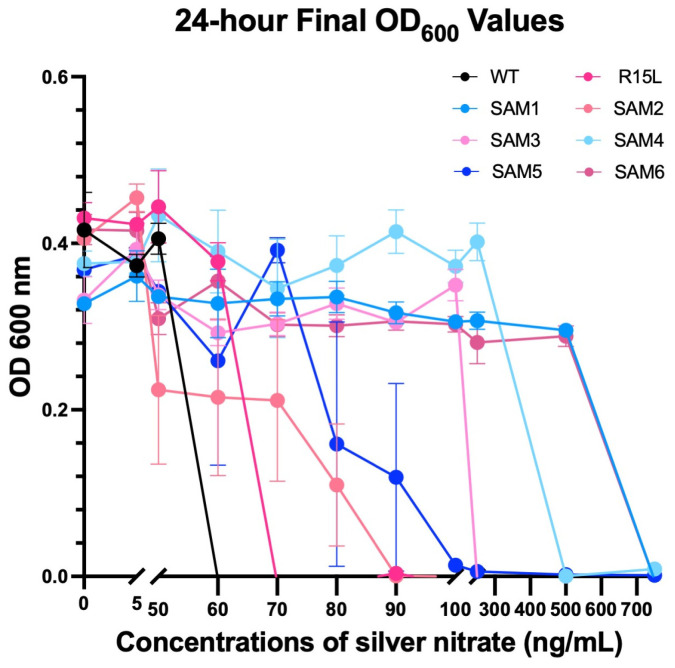
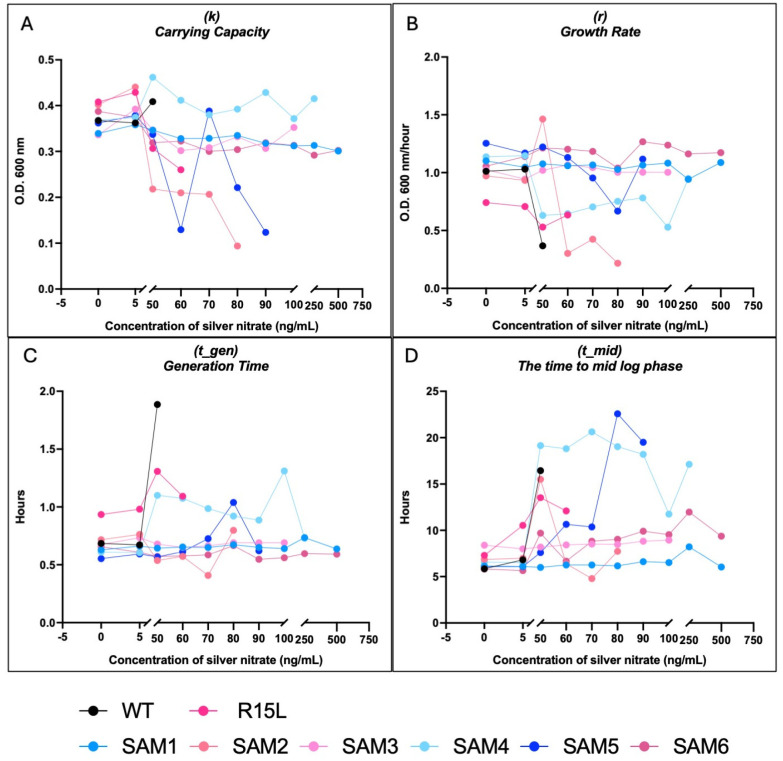
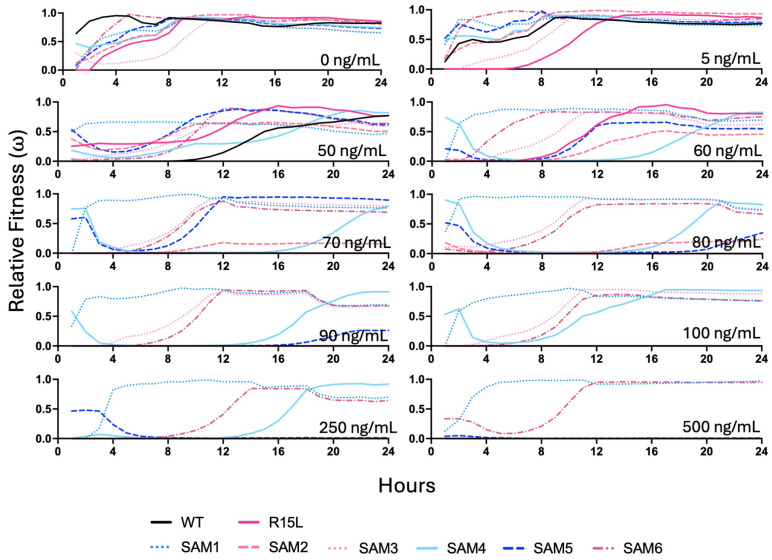
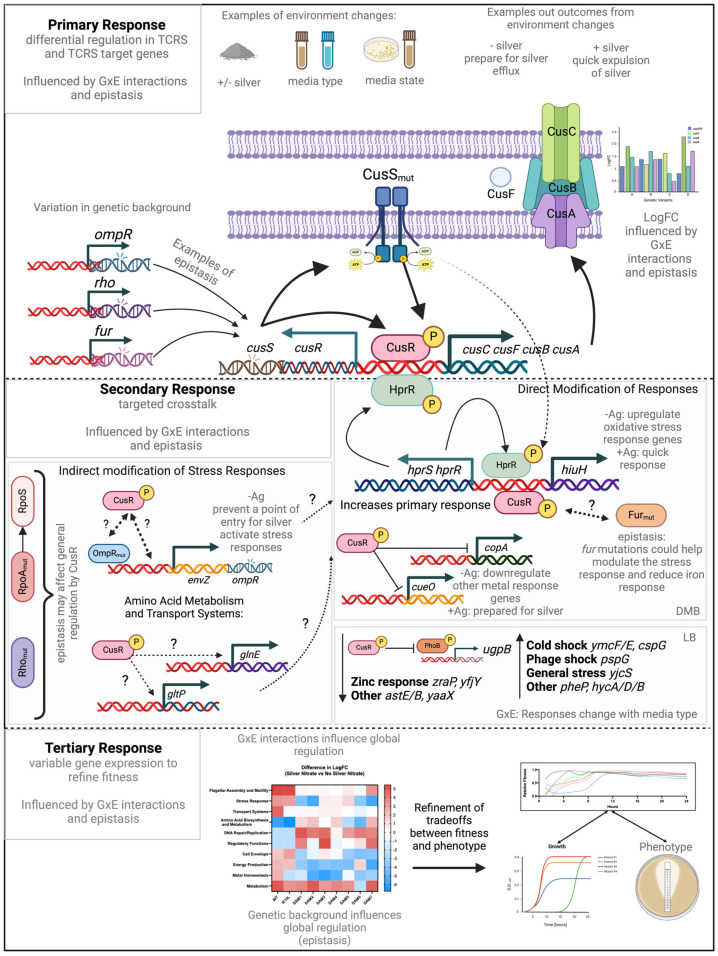
Understanding the interplay between genotype and fitness is a core question in evolutionary biology. Here, we address this challenge in the context of microbial adaptation to environmental stressors. This study explores the role of epistasis in bacterial adaptation by examining genetic and phenotypic changes in silver-adapted Escherichia coli populations, focusing on the role of beneficial mutations in two-component response systems (TCRS). To do this, we measured 24-hour growth assays and conducted whole-genome DNA and RNA sequencing on E. coli mutants that confer resistance to ionic silver. We showed recently that the R15L cusS mutation is central to silver resistance, primarily through upregulation of the cus efflux system. However, here we show that this mutation's effectiveness is significantly enhanced by epistatic interactions with additional mutations in regulatory genes such as ompR, rho, and fur. These interactions reconfigure global stress response networks, resulting in robust and varied resistance strategies across different populations. This study underscores the critical role of epistasis in bacterial adaptation, illustrating how interactions between multiple mutations and how genetic backgrounds shape the resistance phenotypes of E. coli populations. This work also allowed for refinement of our model describing the role TCRS genes play in bacterial adaptation by now emphasizing that adaptation to environmental stressors is a complex, context-dependent process, driven by the dynamic interplay between genetic and environmental factors. These findings have broader implications for understanding microbial evolution and developing strategies to combat antimicrobial resistance.

Keywords: bacterial adaptation; epistasis; gene-by-environment interactions; silver resistance; two-component response systems.


Conflict of interest statement

The authors declare no conflicts of interest. The funders had no role in the design of the study; in the collection, analyses, or interpretation of data; in the writing of the manuscript; or in the decision to publish the results.

Figures

Figure 1
Figure 1
Differential expression of cus genes across silver-adapted E. coli populations: This figure illustrates the expression levels of the cusS/R two-component response system (TCRS) genes and the cusCFBA efflux genes, which are essential for silver and copper ion efflux, across various silver-adapted E. coli populations in both the presence (checkered bars) and absence of silver nitrate (solid bars). All expression levels are normalized to the wild-type (WT) in the absence of silver nitrate, where WT is assigned a log fold change (logFC) of 1. LogFC values were plotted using GraphPad Prism. The upregulation observed in populations with the R15L mutation in cusS highlights its role in enhancing the efficiency of the efflux system, thereby increasing silver resistance. This figure also demonstrates the variation in gene expression across different populations, reflecting their differing capacities to manage metal ion toxicity. Notably, SAM populations that do not carry the R15L mutation exhibit no expression in the cusS/R genes and downregulate the efflux pump genes, indicating a distinct response mechanism.
Figure 2
Figure 2
Comparative gene expression across 10 biological categories in silver-adapted E. coli populations: Heatmaps illustrate differential expression of genes across 10 key biological categories in various silver-adapted E. coli populations, normalized to the wild-type (WT) in the absence of silver nitrate. Differentially expressed genes were categorized based on their biological functions, and the heatmaps display the averaged differential expression for all genes within each category. Warmer colors indicate higher expression levels, while cooler colors indicate lower expression levels. The heatmaps were generated using GraphPad Prism. Subfigure (A) shows gene expression in the absence of silver nitrate, serving as a baseline to display natural variations in gene regulation and adaptation strategies across different populations. Subfigure (B) highlights gene expression in the presence of silver nitrate. Subfigure (C) is a difference map illustrating the changes in gene expression between conditions with and without silver nitrate, providing a direct comparison of how silver exposure affects gene expression across different biological categories. These heatmaps collectively emphasize how specific genetic backgrounds modulate these adaptive responses to silver exposure.
Figure 3
Figure 3
24-hour final OD600 values from growth response assays of E. coli populations to increasing silver nitrate concentrations. The 24-hour time point from growth response assays of WT, R15L, and SAM1-6 populations in Davis Minimal Broth (DMB) is shown under increasing concentrations of silver nitrate (0–750 ng/mL). OD600 values were measured hourly over 24 h, matching the selection time point used in the original experimental evolution study where the SAM populations evolved. Data were collected in triplicate, with means and standard errors of the mean (SEMs) plotted using GraphPad Prism. To calculate statistical variation between each time point and the WT, we performed a two-way ANOVA with multiple comparisons. Detailed statistical results are provided in Table S2. These growth curves were also used to determine the minimum inhibitory concentration (MIC), defined as the lowest silver concentration at which no growth was observed for a population.
Figure 4
Figure 4
Detailed growth metrics across silver nitrate concentrations. This figure presents detailed growth metrics for each E. coli population under varying silver nitrate concentrations, analyzed using the R package Growthcurver (v0.3.1). Growthcurver fits the growth data to a logistic model, providing key metrics that describe the dynamics of each population. These metrics include growth rate (r), reflecting how quickly the population grows; generation time (t_gen), indicating the time required for the population to double; midpoint time (t_mid), representing the time at which the population reaches half its carrying capacity; and carrying capacity (k), denoting the maximum population size supported under the given conditions. The data generated by Growthcurver were plotted using GraphPad Prism. (A) (k) carrying capacity, (B) (r) on growth rate, (C) on generation time, and (D) on time to mid-log phase. These results, derived from Growthcurver’s comprehensive analysis, highlight the impact of silver stress on growth dynamics and reveal the differing adaptive responses among the populations.
Figure 5
Figure 5
Comparative fitness of E. coli populations under silver nitrate stress. Relative fitness (ω) of each E. coli population under varying concentrations of silver nitrate (0–750 ng/mL) is shown. To calculate relative fitness, the OD600 of each population was divided by the maximum OD600 observed among other genotypes in the population at the same time points. Prior to this calculation, all negative growth values were set to 0 to ensure accurate comparisons, and the data were plotted in GraphPad Prism. Statistical analyses were conducted using a one-way ANOVA with pairwise multiple comparisons (Table S3) in GraphPad Prism. These results underscore the impact of silver stress on the competitive dynamics among the populations.
Figure 6
Figure 6
Refined model of adaptive responses in silver-resistant E. coli Mutants: A refined three-step adaptive response mechanism in silver-resistant E. coli mutants is illustrated, emphasizing the roles of epistasis and genotype-by-environment (GxE) dynamics throughout the adaptive process. Dotted arrows indicate interactions that have not yet been characterized, while thick, bold arrows represent the most critical pathways in the response. The model begins with the Primary Response, where epistatic interactions among mutations in the cusS gene and other regulatory genes lead to the enhanced expression of the CusSR two-component regulatory system (TCRS) and its downstream efflux pump genes, cusCFBA. These interactions, influenced by specific environmental conditions, establish a baseline level of silver resistance that varies across SAM populations due to GxE dynamics. The combined effects of these mutations create a context-dependent expression of resistance traits.

Similar articles

References

    1. Kassen R. Distribution of fitness effects among beneficial mutations before selection in experimental populations of Bacteria. Nat. Genet. 2006;38:484. doi: 10.1038/ng1751. - DOI - PubMed
    1. Barrick J.E., Lenski R.E. Genome dynamics during experimental evolution. Nat. Rev. Genet. 2013;14:827. doi: 10.1038/nrg3564. - DOI - PMC - PubMed
    1. Elena S.F., Lenski R.E. Evolution experiments with microorganisms: The dynamics and genetic bases of adaptation. Nat. Rev. Genet. 2003;4:457–469. doi: 10.1038/nrg1088. - DOI - PubMed
    1. Phillips P.C. Epistasis—The essential role of gene interactions in the structure and evolution of genetic systems. Nat. Rev. Genet. 2008;9:855–867. doi: 10.1038/nrg2452. - DOI - PMC - PubMed
    1. Weinreich D.M., Lan Y., Wylie C.S., Heckendorn R.B. Should evolutionary geneticists worry about higher-order epistasis? Curr. Opin. Genet. Dev. 2013;23:700–707. doi: 10.1016/j.gde.2013.10.007. - DOI - PMC - PubMed

LinkOut - more resources