. 2024 Oct 13;16(20):3466.
doi: 10.3390/nu16203466.

Unveiling Lipidomic Alterations in Metabolic Syndrome: A Study of Plasma, Liver, and Adipose Tissues in a Dietary-Induced Rat Model

Affiliations

Unveiling Lipidomic Alterations in Metabolic Syndrome: A Study of Plasma, Liver, and Adipose Tissues in a Dietary-Induced Rat Model

Snjezana Petrovic et al. Nutrients. .

Abstract

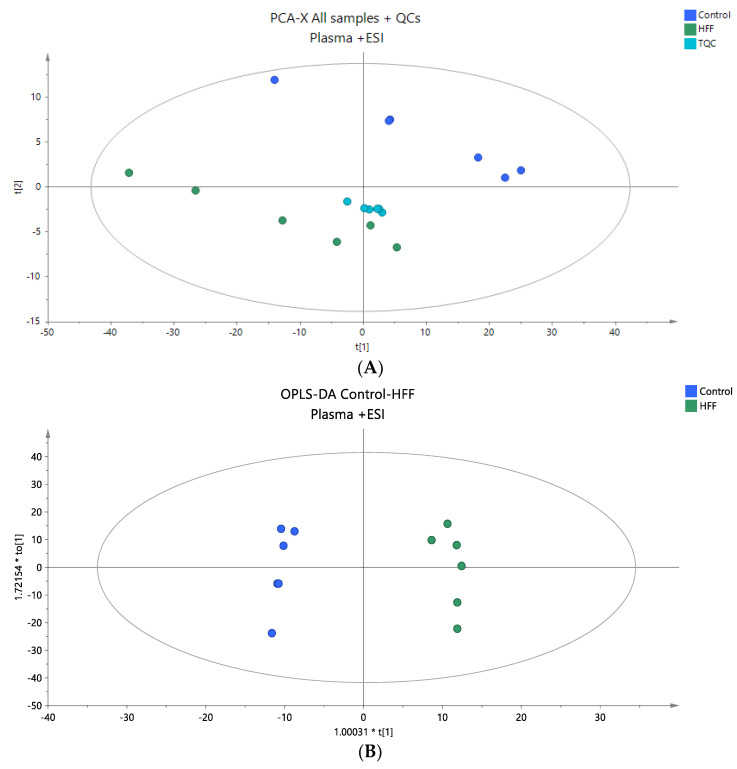
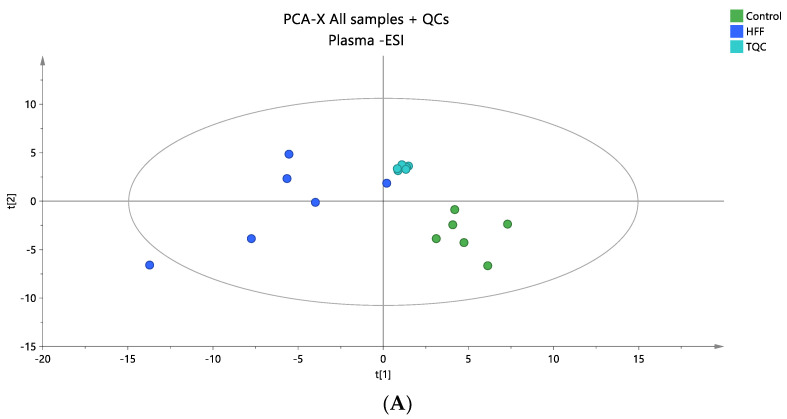
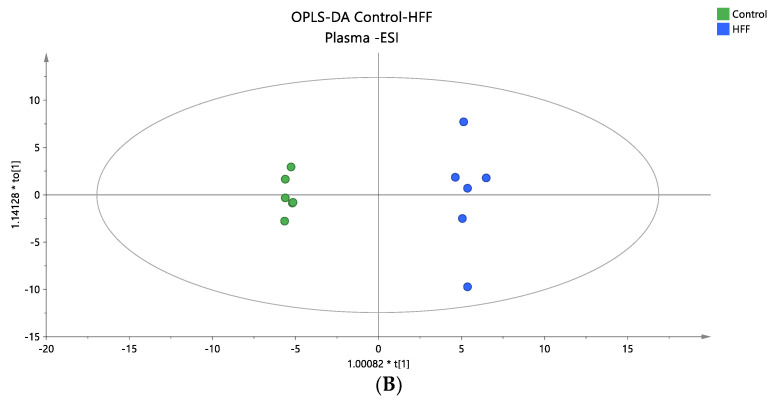
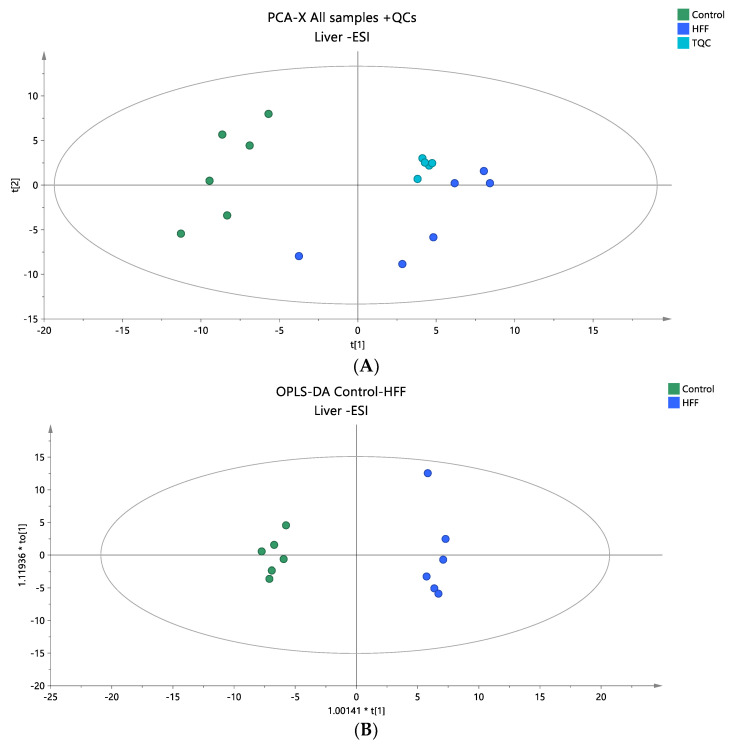
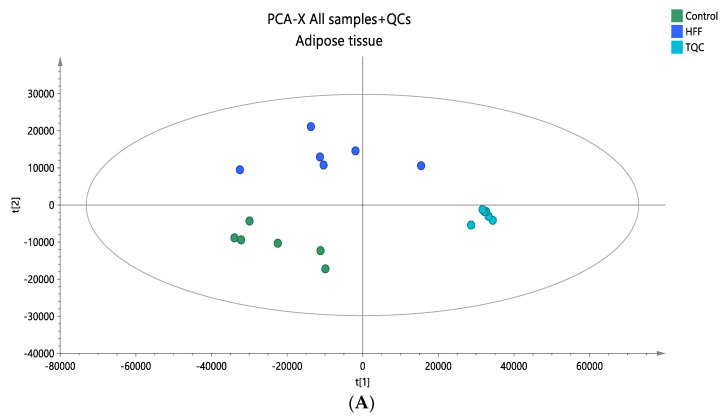
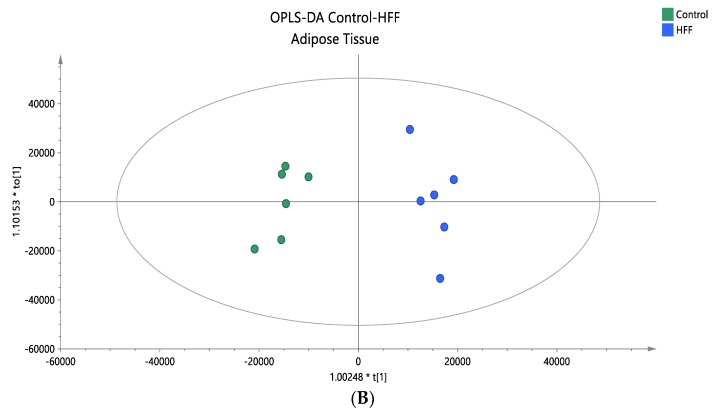
Metabolic syndrome (MetS) is a complex condition characterized by fat accumulation, dyslipidemia, impaired glucose control and hypertension. In this study, rats were fed a high-fat high-fructose (HFF) diet in order to develop MetS. After ten weeks, the dietary-induced MetS was confirmed by higher body fat percentage, lower HDL-cholesterol and increased blood pressure in the HFF-fed rats compared to the normal-fed control animals. However, the effect of MetS development on the lipidomic signature of the dietary-challenged rats remains to be investigated. To reveal the contribution of specific lipids to the development of MetS, the lipid profiling of rat tissues particularly susceptible to MetS was performed using untargeted UHPLC-QTOF-MS/MS lipidomic analysis. A total of 37 lipid species (mainly phospholipids, triglycerides, sphingolipids, cholesterol esters, and diglycerides) in plasma, 43 lipid species in liver, and 11 lipid species in adipose tissue were identified as dysregulated between the control and MetS groups. Changes in the lipid signature of selected tissues additionally revealed systemic changes in the dietary-induced rat model of MetS.

Keywords: adipose tissue; animal model; liver; metabolic syndrome; plasma; untargeted lipidomics.


Conflict of interest statement

The authors declare no conflicts of interest.

Figures

Figure 1
Figure 1
(A) A PCA score plot for the two studied groups, control and HFF, and QC samples were constructed for the analysis of plasma samples. QC samples are depicted in light blue and clustered together (R2X = 0.880, Q2 = 0.660). (B) The OPLS-DA plot illustrates the constructed model of control versus HFF (R2X = 0.786, R2Y = 0.989 Q2 = 0.867, CV ANOVA p-value 4.36 × 10⁻³). Logarithmic transformation of the data and Pareto scaling were used in all plasma models in positive ionization mode.
Figure 2
Figure 2
(A) A PCA score plot for the two studied groups, control and HFF, and QC samples were constructed for the analysis of plasma samples. QC samples are depicted in light blue and clustered together (R2X = 0.609, Q2 = 0.139). (B) The OPLS-DA plot illustrates the constructed model of control versus HFF (R2X = 0.419, R2Y = 0.994, Q2 = 0.835, CV ANOVA p-value 7.47 × 10⁻³). Logarithmic transformation of the data and Pareto scaling were used in all plasma models in negative ionization mode.
Figure 2
Figure 2
(A) A PCA score plot for the two studied groups, control and HFF, and QC samples were constructed for the analysis of plasma samples. QC samples are depicted in light blue and clustered together (R2X = 0.609, Q2 = 0.139). (B) The OPLS-DA plot illustrates the constructed model of control versus HFF (R2X = 0.419, R2Y = 0.994, Q2 = 0.835, CV ANOVA p-value 7.47 × 10⁻³). Logarithmic transformation of the data and Pareto scaling were used in all plasma models in negative ionization mode.
Figure 3
Figure 3
(A) A PCA score plot for two studied groups, control and HFF, and QC samples were constructed for the analysis of liver samples. QC samples are depicted in light blue and clustered together (R2X = 0.861, Q2 = 0.442). (B) The OPLS-DA plot illustrates the constructed model of control versus HFF (R2X = 0.602, R2Y = 0.986, Q2 = 0.949, CV ANOVA p-value 1.44 × 10⁻⁴). Logarithmic transformation of the data and Pareto scaling were used in all liver models in positive ionization mode.
Figure 4
Figure 4
(A) A PCA score plot for two studied groups, control and HFF, and QC samples were constructed for the analysis of liver samples. QC samples are depicted in light blue and clustered together (R2X = 0.737, Q2 = 0.221). (B) The OPLS-DA plot illustrates the constructed model of control versus HFF (R2X = 0.519, R2Y = 0.991, Q2 = 0.896, CV ANOVA p-value 1.62 × 10⁻³). Logarithmic transformation of the data and Pareto scaling were used in all plasma models in negative ionization mode.
Figure 5
Figure 5
(A) A PCA score plot for the two studied groups, control and HFF, and QC samples were constructed. QC samples are depicted in light blue and clustered together (R2X = 0.886, Q2 = 0.676). (B) The OPLS-DA plot illustrates the constructed model of control versus HFF (R2X = 0.670, R2Y = 0.961, Q2 = 0.886, CV ANOVA p-value 2.00 × 10⁻³). Pareto scaling was used in all adipose tissue models.
Figure 5
Figure 5
(A) A PCA score plot for the two studied groups, control and HFF, and QC samples were constructed. QC samples are depicted in light blue and clustered together (R2X = 0.886, Q2 = 0.676). (B) The OPLS-DA plot illustrates the constructed model of control versus HFF (R2X = 0.670, R2Y = 0.961, Q2 = 0.886, CV ANOVA p-value 2.00 × 10⁻³). Pareto scaling was used in all adipose tissue models.

Similar articles

References

    1. Saklayen M.G. The Global Epidemic of the Metabolic Syndrome. Curr. Hypertens. Rep. 2018;20:12. doi: 10.1007/s11906-018-0812-z. - DOI - PMC - PubMed
    1. Madan K., Paliwal S., Sharma S., Kesar S., Chauhan N., Madan M. Metabolic Syndrome: The Constellation of Co-Morbidities, A Global Threat. Endocr. Metab. Immune Disord. Drug Targets. 2023;23:1491–1504. doi: 10.2174/1871530323666230309144825. - DOI - PubMed
    1. Fahed G., Aoun L., Bou Zerdan M., Allam S., Bou Zerdan M., Bouferraa Y., Assi H.I. Metabolic Syndrome: Updates on Pathophysiology and Management in 2021. Int. J. Mol. Sci. 2022;23:786. doi: 10.3390/ijms23020786. - DOI - PMC - PubMed
    1. Gunawan S., Aulia A., Soetikno V. Development of Rat Metabolic Syndrome Models: A Review. Vet. World. 2021;14:1774–1783. doi: 10.14202/vetworld.2021.1774-1783. - DOI - PMC - PubMed
    1. Paunovic M., Milosevic M., Mitrovic-Ajtic O., Velickovic N., Micic B., Nedic O., Todorovic V., Vucic V., Petrovic S. Polyphenol-Rich Black Currant and Cornelian Cherry Juices Ameliorate Metabolic Syndrome Induced by a High-Fat High-Fructose Diet in Wistar Rats. Heliyon. 2024;10:e27709. doi: 10.1016/j.heliyon.2024.e27709. - DOI - PMC - PubMed

LinkOut - more resources