. 2024 Oct 21;16(20):3563.
doi: 10.3390/nu16203563.

Beneficial Effects of Ginger Root Extract on Pain Behaviors, Inflammation, and Mitochondrial Function in the Colon and Different Brain Regions of Male and Female Neuropathic Rats: A Gut-Brain Axis Study

Affiliations

Beneficial Effects of Ginger Root Extract on Pain Behaviors, Inflammation, and Mitochondrial Function in the Colon and Different Brain Regions of Male and Female Neuropathic Rats: A Gut-Brain Axis Study

Julianna Maria Santos et al. Nutrients. .

Abstract

Background: Neuroinflammation and mitochondrial dysfunction have been implicated in the progression of neuropathic pain (NP) but can be mitigated by supplementation with gingerol-enriched ginger (GEG). However, the exact benefits of GEG for each sex in treating neuroinflammation and mitochondrial homeostasis in different brain regions and the colon remain to be determined.

Objective: Evaluate the effects of GEG on emotional/affective pain and spontaneous pain behaviors, neuroinflammation, as well as mitochondria homeostasis in the amygdala, frontal cortex, hippocampus, and colon of male and female rats in the spinal nerve ligation (SNL) NP model.

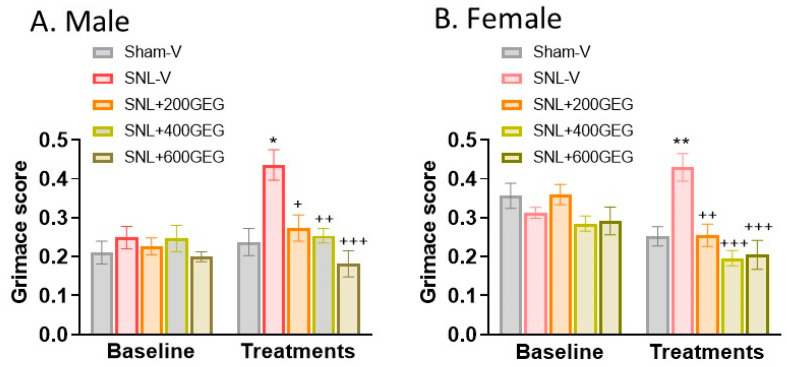
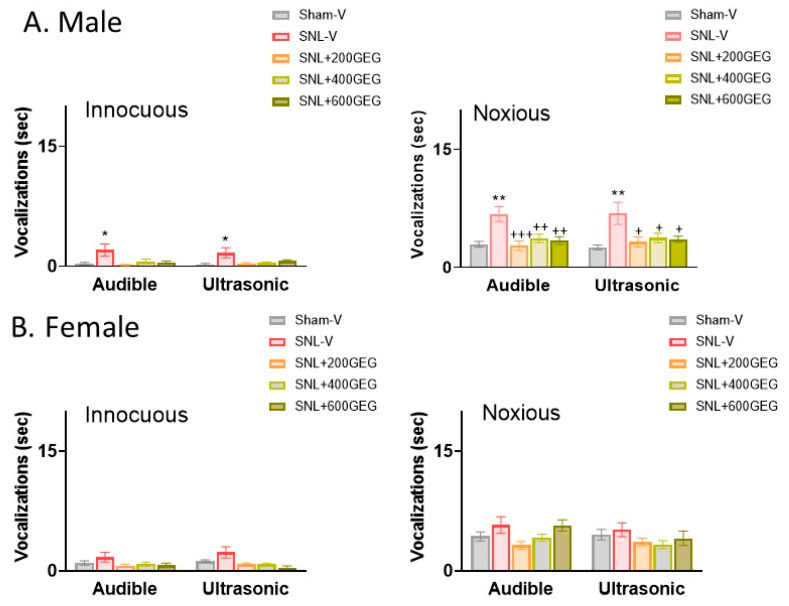
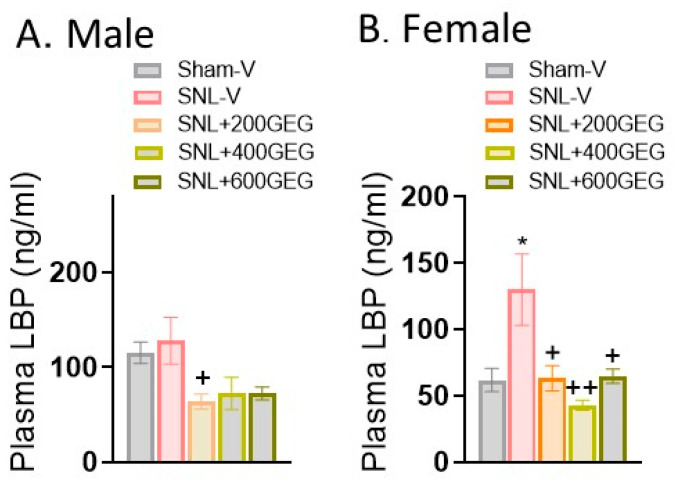
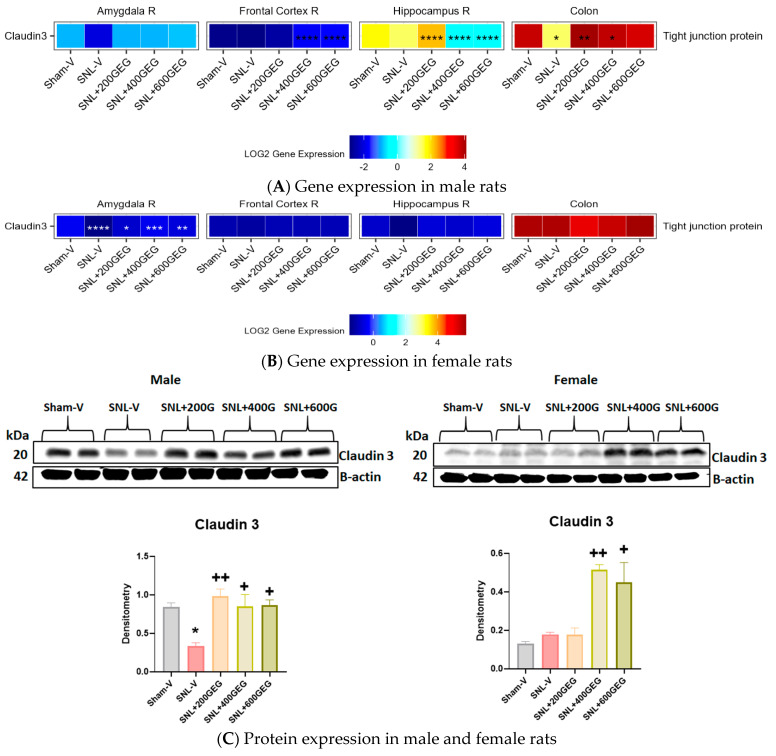
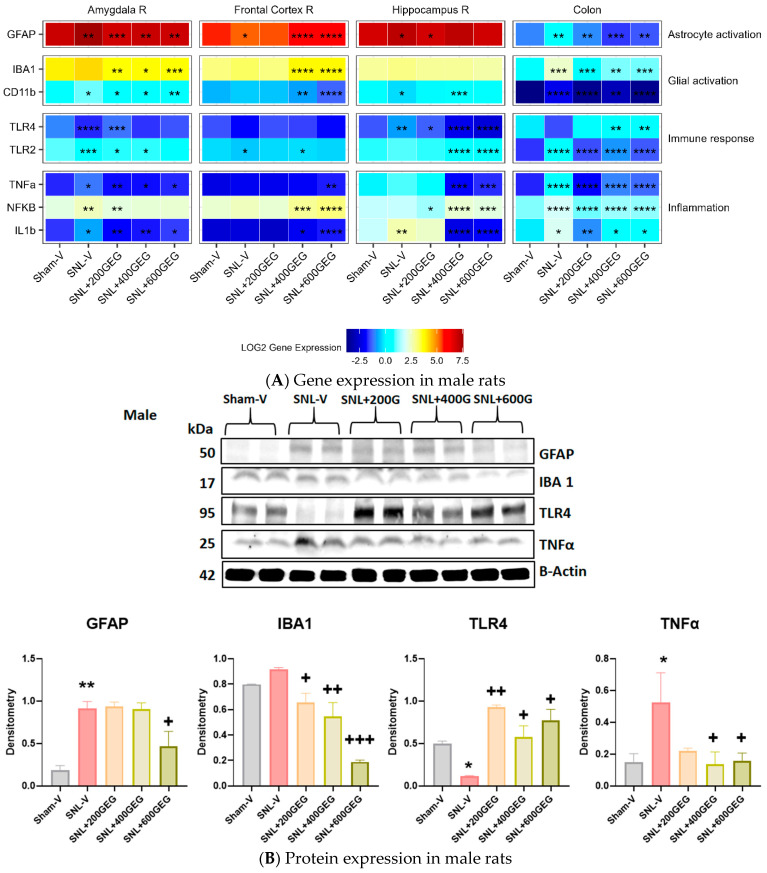
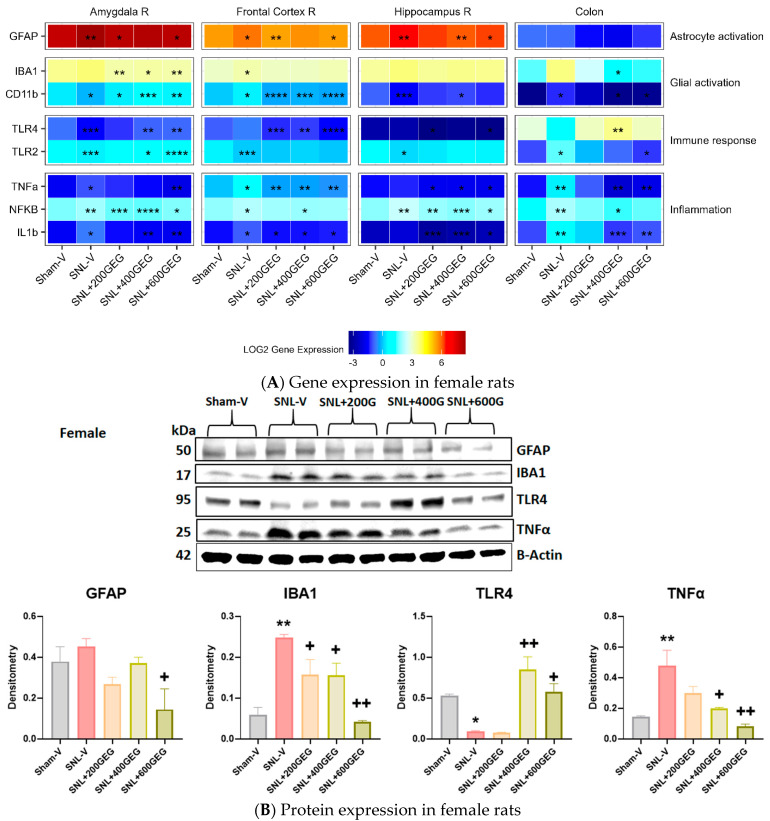
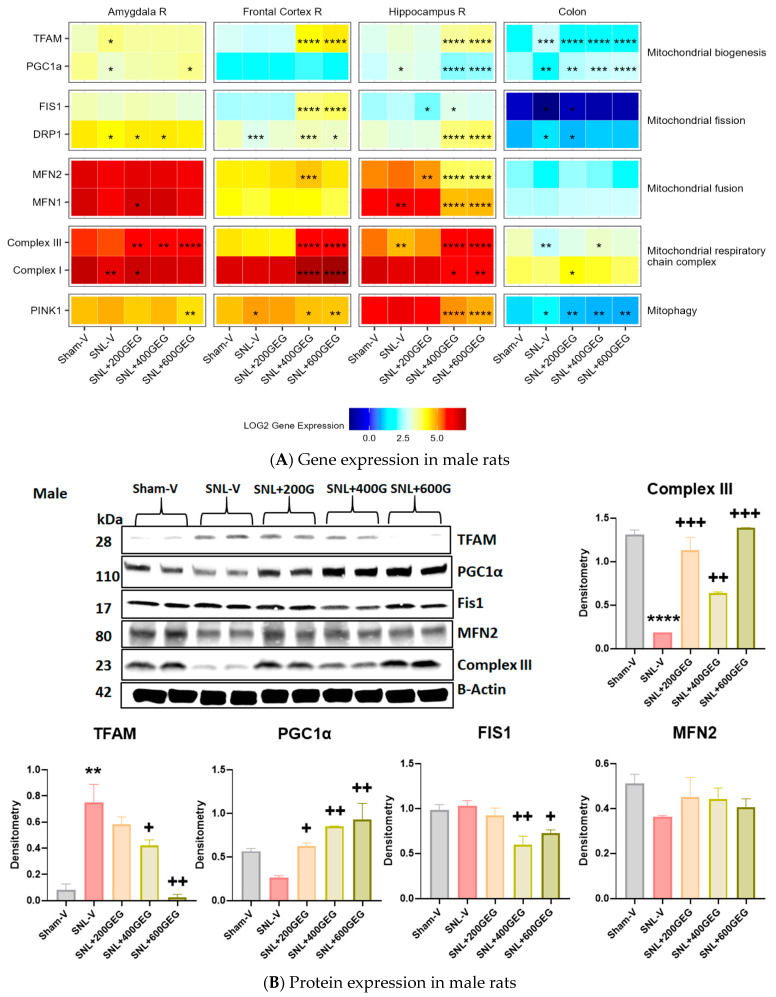
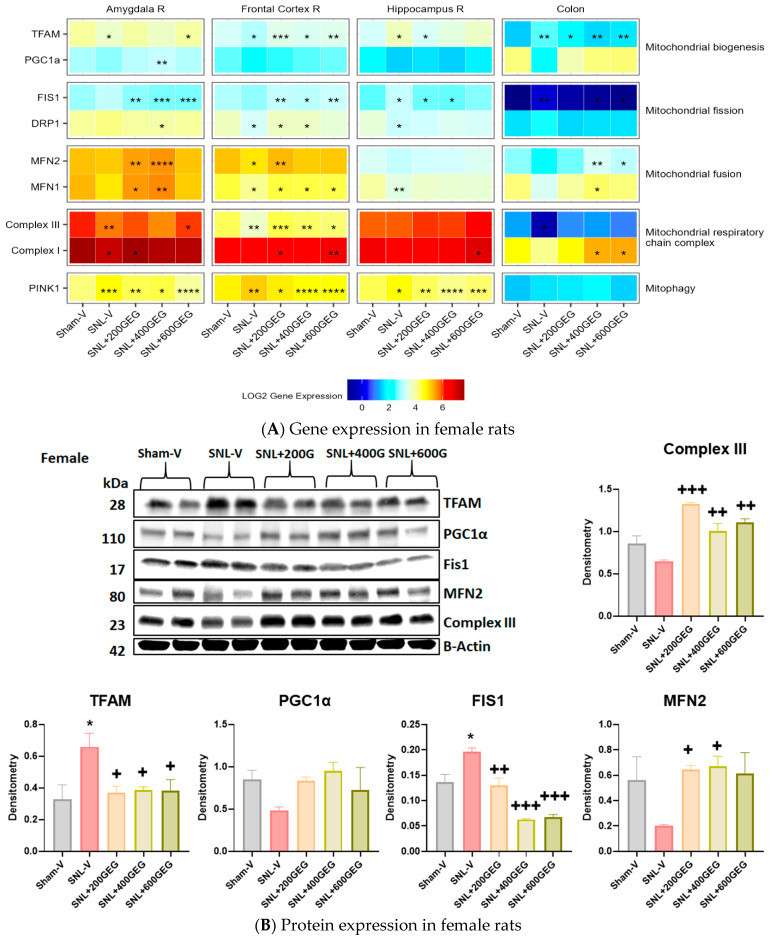
Methods: One hundred rats (fifty males and fifty females) were randomly assigned to five groups: sham + vehicle, SNL + vehicle, and SNL with three different GEG doses (200, 400, and 600 mg/kg BW) for 5 weeks. A rat grimace scale and vocalizations were used to assess spontaneous and emotional/affective pain behaviors, respectively. mRNA gene and protein expression levels for tight junction protein, neuroinflammation, mitochondria homeostasis, and oxidative stress were measured in the amygdala, frontal cortex, hippocampus, and colon using qRT-PCR and Western blot (colon).

Results: GEG supplementation mitigated spontaneous pain in both male and female rats with NP while decreasing emotional/affective responses only in male NP rats. GEG supplementation increased intestinal integrity (claudin 3) and suppressed neuroinflammation [glial activation (GFAP, CD11b, IBA1) and inflammation (TNFα, NFκB, IL1β)] in the selected brain regions and colon of male and female NP rats. GEG supplementation improved mitochondrial homeostasis [increased biogenesis (TFAM, PGC1α), increased fission (FIS, DRP1), decreased fusion (MFN2, MFN1) and mitophagy (PINK1), and increased Complex III] in the selected brain regions and colon in both sexes. Some GEG dose-response effects in gene expression were observed in NP rats of both sexes.

Conclusions: GEG supplementation decreased emotional/affective pain behaviors of males and females via improving gut integrity, suppressing neuroinflammation, and improving mitochondrial homeostasis in the amygdala, frontal cortex, hippocampus, and colon in both male and female SNL rats in an NP model, implicating the gut-brain axis in NP. Sex differences observed in the vocalizations assay may suggest different mechanisms of evoked NP responses in females.

Keywords: animals; bioactive compounds; central nervous system; leaky gut; mitochondrial function; neuroimmune signaling; pain.


Conflict of interest statement

The authors declare no conflicts of interest.

Figures

Figure 1
Figure 1
Effects of GEG on spontaneous pain (RGS score) in the male rats (A) and female rats (B). Data are expressed as mean ± SEM and were analyzed by one-way ANOVA followed by Bonferroni multiple comparisons test, n = 9 per group. * p < 0.05, ** p < 0.01 for SNL-V vs. Sham-V group. + p < 0.05, ++ p < 0.01, +++ p < 0.001 SNL-GEG groups vs. SNL-V group.
Figure 2
Figure 2
Effects of GEG on emotional pain responses (duration of vocalizations) in the male rats (A) and female rats (B). Data are expressed as mean ± SEM and were analyzed by one-way ANOVA followed by Bonferroni multiple comparisons test. n = 5–7 per group. * p < 0.05, ** p < 0.01 for SNL-V vs. Sham-V group. + p < 0.05, ++ p < 0.01, +++ p < 0.001 for other groups vs. SNL-V group.
Figure 3
Figure 3
Effects of GEG on plasma LBP in the male rats (A) and female rats (B) assessed by ELISA. Data are expressed as mean ± SEM and were analyzed by one-way ANOVA followed by Bonferroni multiple comparisons test. n = 4–6 per group. * p < 0.05 compared with Sham-V group. + p < 0.05, ++ p < 0.01 compared with SNL-V group.
Figure 4
Figure 4
Effects of GEG on claudin 3 gene expression levels in amygdala, frontal cortex, hippocampus, and colon of male rats (A) and female rats (B) and protein expression levels in colon of male and female rats (C). For gene expression, data are expressed as mean ± SEM and were analyzed by one-way ANOVA followed by Tukey’s test, n = 7–9 per group. * p < 0.05, ** p < 0.01, *** p < 0.001, **** p < 0.0001 for SNL-V vs. Sham-V group, and other groups vs. SNL-V group. For protein expression, data are expressed as mean ± SEM and were analyzed by one-way ANOVA followed by Tukey’s multiple comparisons test, n = 7–9 per group. * p < 0.05 compared with Sham-V group. + p < 0.05, ++ p < 0.01 compared with SNL-V group.
Figure 5
Figure 5
Effects of GEG on the neuroinflammation-associated gene expression levels in amygdala, frontal cortex, hippocampus, and colon of male rats (A) and protein expression levels in colon of male rats (B). For gene expression, data are expressed as mean ± SEM and were analyzed by one-way ANOVA followed by Tukey’s test, n = 7–9 per group. * p < 0.05, ** p < 0.01, *** p < 0.001, **** p < 0.0001 for SNL-V vs. Sham-V group, and other groups vs. SNL-V group. For protein expression, data are expressed as mean ± SEM and were analyzed by one-way ANOVA followed by Tukey’s multiple comparisons test, n = 7–9 per group. * p < 0.05, ** p < 0.01 compared with Sham-V group. + p < 0.05, ++ p < 0.01, +++ p < 0.001 compared with SNL-V group.
Figure 6
Figure 6
Effects of GEG on the neuroinflammation-associated gene expression levels in amygdala, frontal cortex, hippocampus, and colon of female rats (A) and protein expression levels in colon of female rats (B). For gene expression, data are expressed as mean ± SEM and were analyzed by one-way ANOVA followed by Tukey’s test, n = 7–9 per group. * p < 0.05, ** p < 0.01, *** p < 0.001, **** p < 0.0001 for SNL-V vs. Sham-V group, and other groups vs. SNL-V group. For protein expression, data are expressed as mean ± SEM and were analyzed by one-way ANOVA followed by Tukey’s multiple comparisons test, n = 7–9 per group. * p < 0.05, ** p < 0.01 compared with Sham-V group. + p < 0.05, ++ p < 0.01 compared with SNL-V group.
Figure 7
Figure 7
Effects of GEG on mitochondrial function-associated gene expression levels in amygdala, frontal cortex, hippocampus, and colon of male rats (A) and protein expression levels in colon of male rats (B). For gene expression, data are expressed as mean ± SEM and were analyzed by one-way ANOVA followed by Tukey’s test, n = 7–9 per group. * p < 0.05, ** p < 0.01, *** p < 0.001, **** p < 0.0001 for SNL-V vs. Sham-V group, and other groups vs. SNL-V group. For protein expression, data are expressed as mean ± SEM and were analyzed by one-way ANOVA followed by Tukey’s test, n = 7–9 per group. ** p < 0.01, **** p < 0.0001 compared with Sham-V group. + p < 0.05, ++ p < 0.01, +++ p < 0.001 compared with SNL-V group.
Figure 8
Figure 8
Effects of GEG on the mitochondrial function-associated gene expression levels in amygdala, frontal cortex, hippocampus, and colon of female rats (A) and protein expression levels in colon of female rats (B). For gene expression, data are expressed as mean ± SEM and were analyzed by one-way ANOVA followed by Tukey’s test, n = 7–9 per group. * p < 0.05, ** p < 0.01, *** p < 0.001, **** p < 0.0001 for SNL-V vs. Sham-V group, and other groups vs. SNL-V group. For protein expression, data are expressed as mean ± SEM and were analyzed by one-way ANOVA followed by Tukey’s multiple comparisons test, n = 7–9 per group. * p < 0.05 compared with Sham-V group. + p < 0.05, ++ p < 0.01, +++ p < 0.001 compared with SNL-V group.

References

    1. Colloca L., Ludman T., Bouhassira D., Baron R., Dickenson A.H., Yarnitsky D., Freeman R., Truini A., Attal N., Finnerup N.B., et al. Neuropathic pain. Nat. Rev. Dis. Primers. 2017;3:17002. doi: 10.1038/nrdp.2017.2. - DOI - PMC - PubMed
    1. Ji R.R., Nackley A., Huh Y., Terrando N., Maixner W. Neuroinflammation and Central Sensitization in Chronic and Widespread Pain. Anesthesiology. 2018;129:343–366. doi: 10.1097/ALN.0000000000002130. - DOI - PMC - PubMed
    1. Kiguchi N., Maeda T., Kobayashi Y., Saika F., Kishioka S. Involvement of inflammatory mediators in neuropathic pain caused by vincristine. Int. Rev. Neurobiol. 2009;85:179–190. doi: 10.1016/S0074-7742(09)85014-9. - DOI - PubMed
    1. Chen G., Zhang Y.Q., Qadri Y.J., Serhan C.N., Ji R.R. Microglia in Pain: Detrimental and Protective Roles in Pathogenesis and Resolution of Pain. Neuron. 2018;100:1292–1311. doi: 10.1016/j.neuron.2018.11.009. - DOI - PMC - PubMed
    1. Kiguchi N., Kobayashi Y., Kishioka S. Chemokines and cytokines in neuroinflammation leading to neuropathic pain. Curr. Opin. Pharmacol. 2012;12:55–61. doi: 10.1016/j.coph.2011.10.007. - DOI - PubMed

MeSH terms

LinkOut - more resources