. 2024 Oct 17;13(20):2908.
doi: 10.3390/plants13202908.

Ascophyllum nodosum Extract Improves Olive Performance Under Water Deficit Through the Modulation of Molecular and Physiological Processes

Affiliations

Ascophyllum nodosum Extract Improves Olive Performance Under Water Deficit Through the Modulation of Molecular and Physiological Processes

Maria Celeste Dias et al. Plants (Basel). .

Abstract

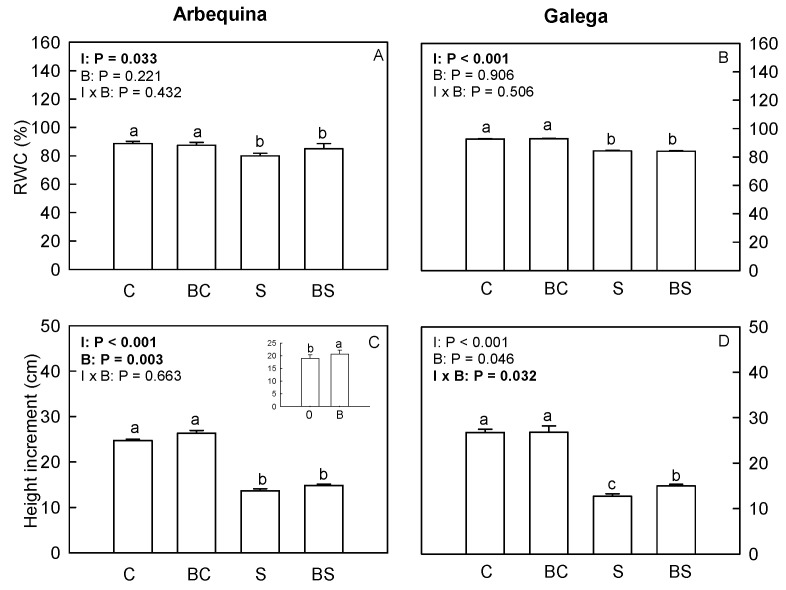
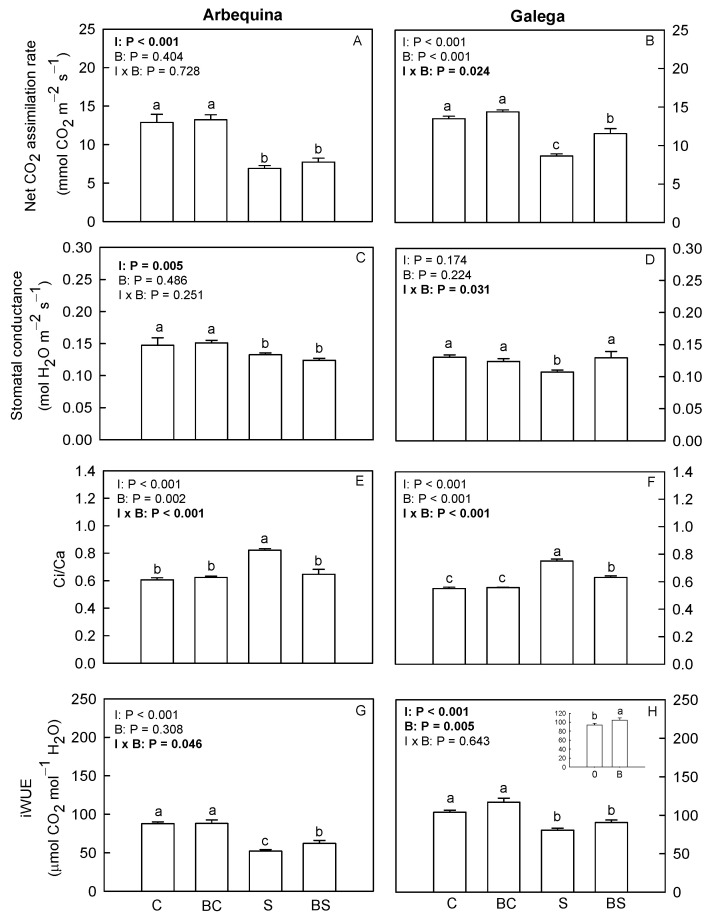
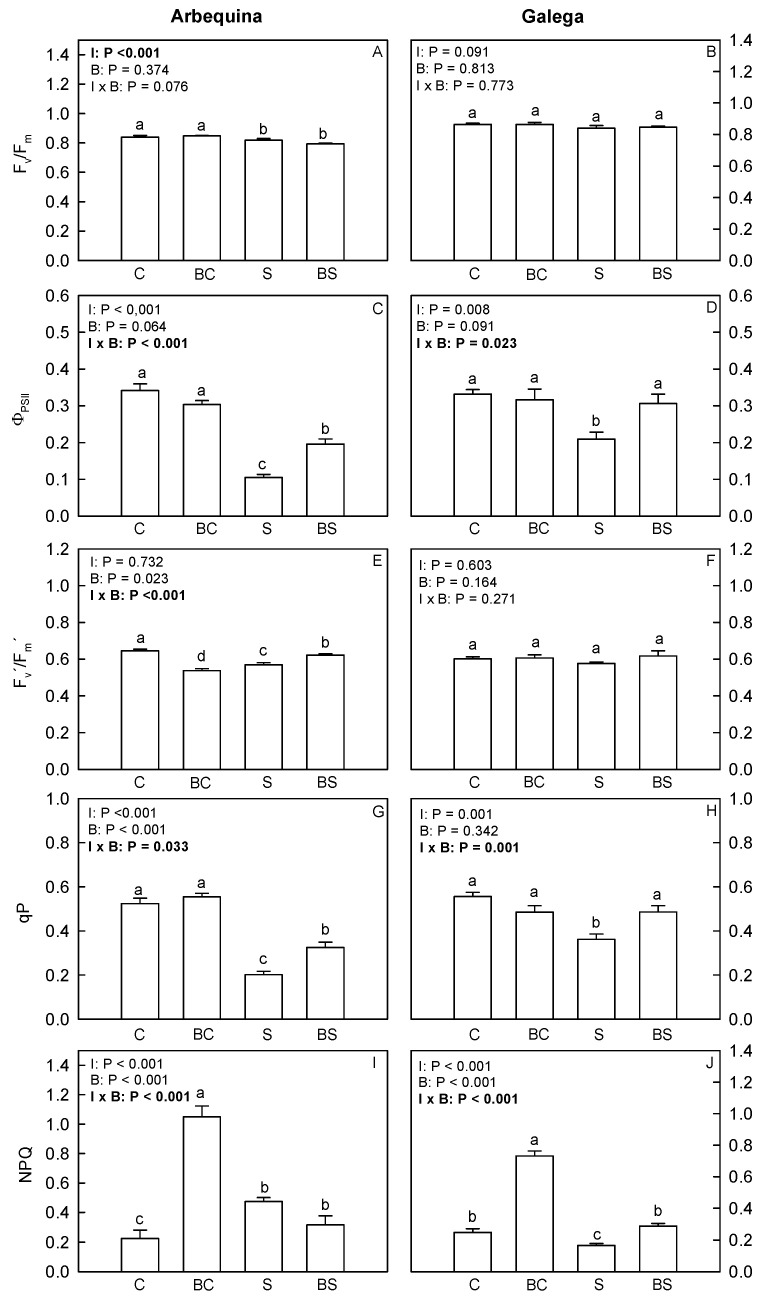
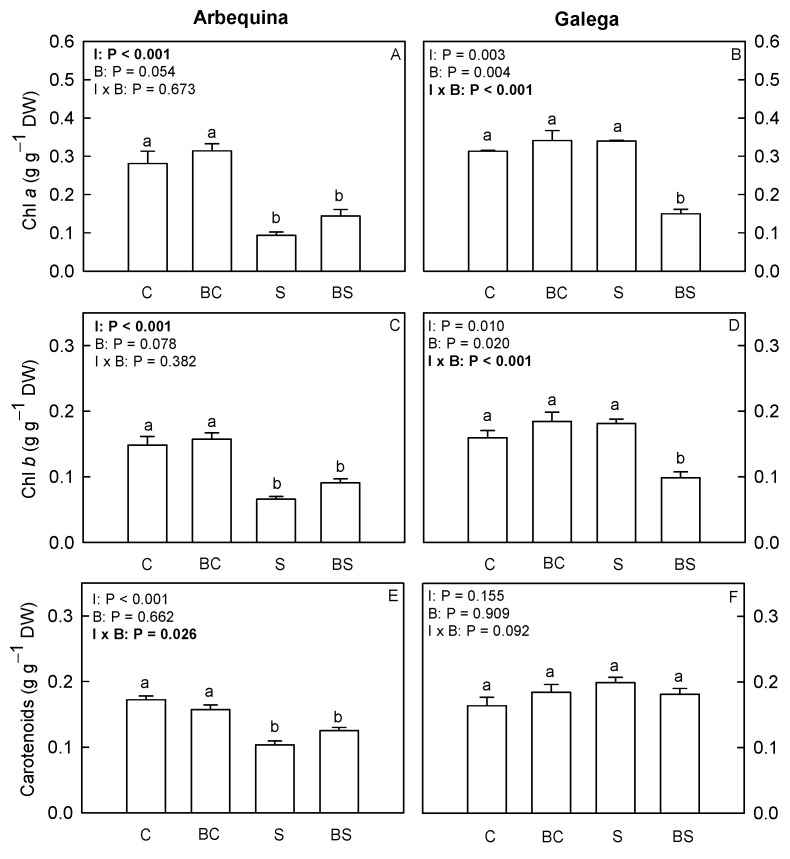
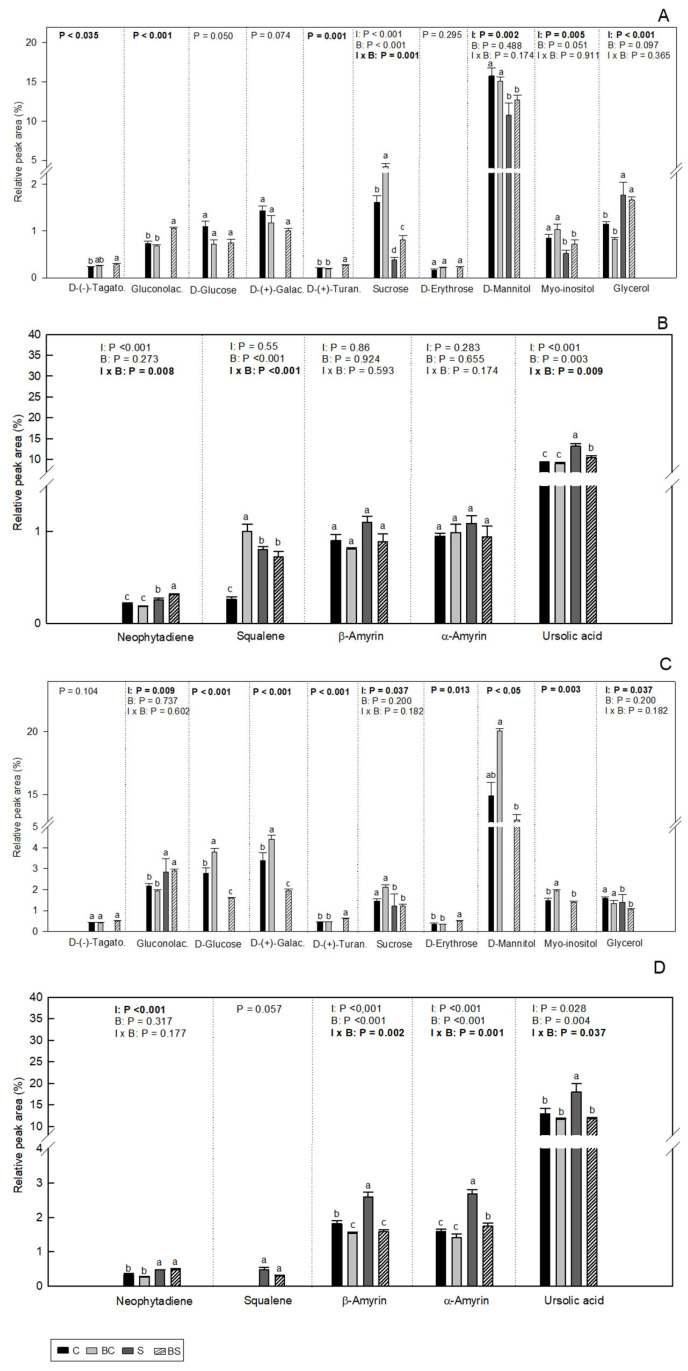
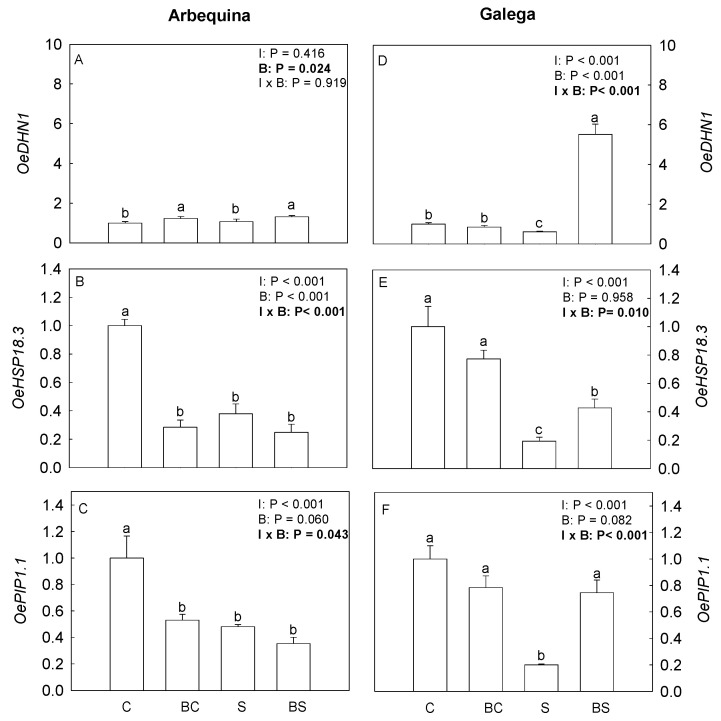
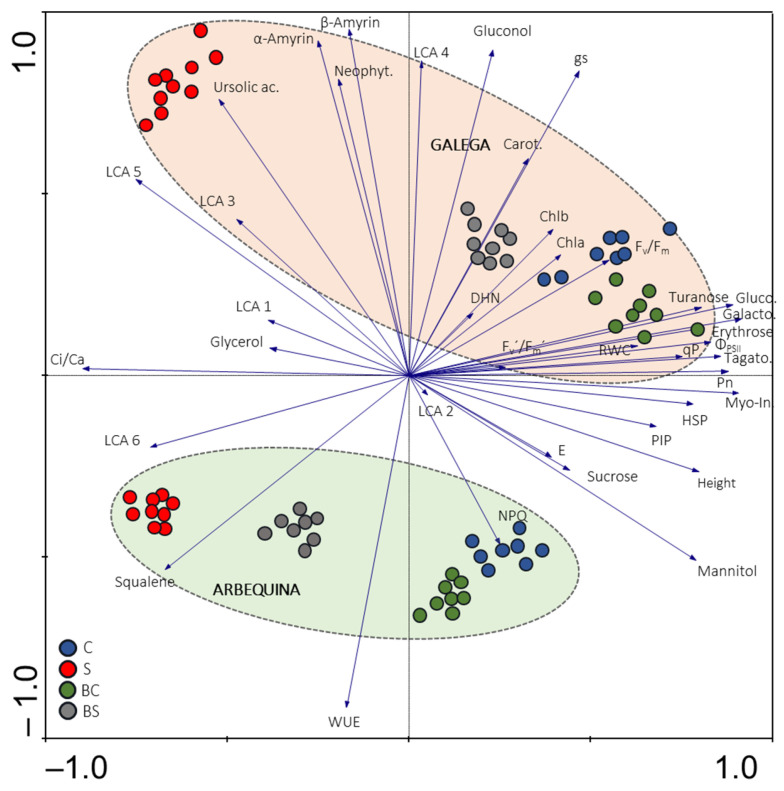
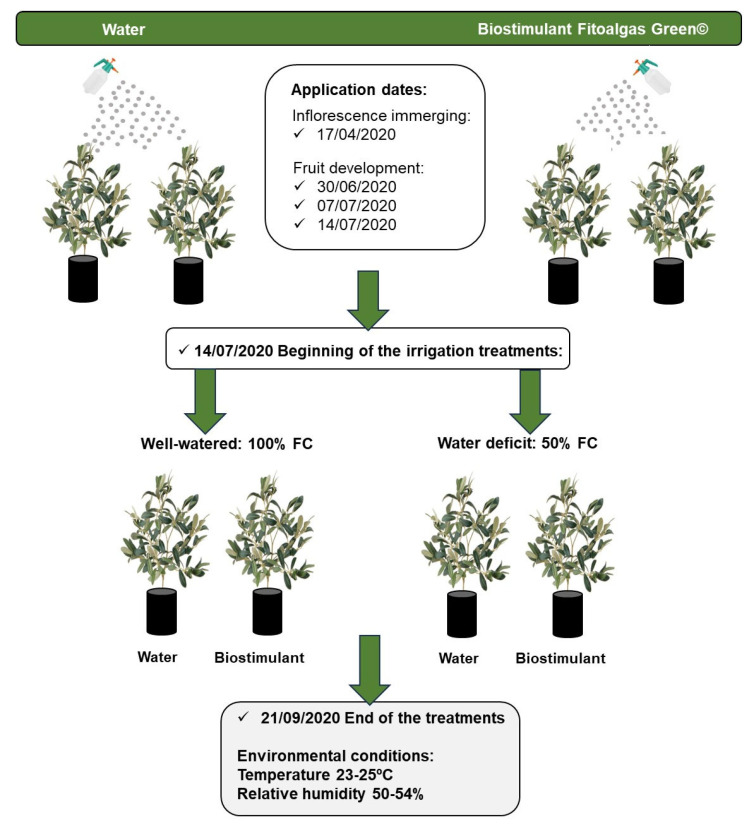
The olive tree is well adapted to the Mediterranean climate, but how orchards based on intensive practices will respond to increasing drought is unknown. This study aimed to determine if the application of a commercial biostimulant improves olive tolerance to drought. Potted plants (cultivars Arbequina and Galega) were pre-treated with an extract of Ascophyllum nodosum (four applications, 200 mL of 0.50 g/L extract per plant), and were then well irrigated (100% field capacity) or exposed to water deficit (50% field capacity) for 69 days. Plant height, photosynthesis, water status, pigments, lipophilic compounds, and the expression of stress protective genes (OeDHN1-protective proteins' dehydrin; OePIP1.1-aquaporin; and OeHSP18.3-heat shock proteins) were analyzed. Water deficit negatively affected olive physiology, but the biostimulant mitigated these damages through the modulation of molecular and physiological processes according to the cultivar and irrigation. A. nodosum benefits were more expressive under water deficit, particularly in Galega, promoting height (increase of 15%) and photosynthesis (increase of 34%), modulating the stomatal aperture through the regulation of OePIP1.1 expression, and keeping OeDHN1 and OeHSP18.3 upregulated to strengthen stress protection. In both cultivars, biostimulant promoted carbohydrate accumulation and intrinsic water-use efficiency (iWUE). Under good irrigation, biostimulant increased energy availability and iWUE in Galega. These data highlight the potential of this biostimulant to improve olive performance, providing higher tolerance to overcome climate change scenarios. The use of this biostimulant can improve the establishment of younger olive trees in the field, strengthen the plant's capacity to withstand field stresses, and lead to higher growth and crop productivity.

Keywords: aquaporins; biostimulants; dehydrins; drought; heat shock proteins; photosynthesis.


Conflict of interest statement

The authors declare no conflicts of interest.

Figures

Figure 1
Figure 1
Leaf relative water content (RWC) (A,B) and plant height increment (C,D) in O. europaea plants of the treatments C (well-watered), BC (biostimulant + well-watered), S (water deficit), and BS (biostimulant + water deficit). Bars represent mean ± standard error (n = 5–10). The effect of the factor irrigation (I), factor biostimulant (B), and the interaction between the factor irrigation and biostimulant (I × B) are presented, and when the effect of each factor or the interaction is statistically significant (p ≤ 0.05), it appears in bold. Different letters indicate statistically significant differences (p ≤ 0.05). Significant differences among I × B refer to differences between C, BC, S, and BS treatments. Significant differences among the factor I refer to differences between 100% (treatments C and BC) and 50% irrigation (treatments S and BS). Significant differences among the factor B are shown in a chart at the top of the corresponding graph, and statistic letters refer to treatments without biostimulant (0: treatments C and S) and treatments with biostimulant (B: treatments BC and BS).
Figure 2
Figure 2
Net CO2-assimilation rate (A,B), stomatal conductance (C,D), ratio of intercellular CO2 and extracellular CO2 concentration (Ci/Ca) (E,F), and intrinsic water-use efficiency (G,H) in O. europaea plants of the treatments C (well-watered), BC (biostimulant + well-watered), S (water deficit), and BS (biostimulant + water deficit). Bars represent mean ± standard error (n = 6–9). The effect of the factor irrigation (I), factor biostimulant (B), and the interaction between the factor irrigation and biostimulant (I × B) are presented, and when the effect of each factor or the interaction is statistically significant (p ≤ 0.05), it appears in bold. Different letters indicate statistically significant differences (p ≤ 0.05). Significant differences among I × B refer to differences between C, BC, S, and BS treatments. Significant differences among the factor I refer to differences between 100% (treatments C and BC) and 50% irrigation (treatments S and BS). Significant differences among the factor B are shown in a chart at the top of the corresponding graph, and statistic letters refer to treatments without biostimulant (0: treatments C and S) and treatments with biostimulant (B: treatments BC and BS).
Figure 3
Figure 3
Maximum efficiency of PSII (Fv/Fm) (A,B), effective efficiency of PSII (ΦPSII) (C,D), efficiency of excitation energy capture by open PSII reaction centers (Fv′/Fm′) (E,F), photochemical quenching (qP) (G,H), and non-photochemical quenching (NPQ) (I,J) in O. europaea plants of the treatments C (well-watered), BC (biostimulant + well-watered), S (water deficit), and BS (biostimulant + water deficit). Bars represent mean ± standard error (n = 5–10). The effect of the factor irrigation (I), factor biostimulant (B), and the interaction between the factor irrigation and biostimulant (I × B) are presented, and when the effect of each factor or the interaction is statistically significant (p ≤ 0.05), it appears in bold. Different letters indicate statistically significant differences (p ≤ 0.05). Significant differences among I × B refer to differences between C, BC, S, and BS treatments. Significant differences among the factor I refer to differences between 100% (treatments C and BC) and 50% irrigation (treatments S and BS).
Figure 4
Figure 4
Chlorophyll a (A,B) and b (C,D), and carotenoid (E,F) contents in O. europaea plants of the treatments C (well-watered), BC (biostimulant + well-watered), S (water deficit), and BS (biostimulant + water deficit). Bars represent mean ± standard error (n = 6–8). The effect of the factor irrigation (I), factor biostimulant (B), and the interaction between the factor irrigation and biostimulant (I × B) are presented, and when the effect of each factor or the interaction is statistically significant (p ≤ 0.05), it appears in bold. Different letters indicate statistically significant difference (p ≤ 0.05). Significant differences among I × B refer to differences between C, BC, S, and BS treatments. Significant differences among the factor I refer to differences between 100% (treatments C and BC) and 50% irrigation (treatments S and BS).
Figure 5
Figure 5
Carbohydrate (A,C) and terpene (B,D) relative abundance (%) in O. europaea plants of the cultivar Arbequina (A,B) and Galega (C,D) in the treatments C (well-watered), BC (biostimulant + well-watered), S (water deficit), and BS (biostimulant + water deficit). Bars represent mean ± standard error (n = 3–4). The effect of the factor irrigation (I), factor biostimulant (B), and the interaction between the factor irrigation and biostimulant (I × B) are presented, and when the effect of each factor or the interaction is statistically significant (p ≤ 0.05), it appears in bold. Different letters indicate statistically significant difference (p ≤ 0.05). Significant differences among I × B refer to differences between C, BC, S, and BS treatments. Significant differences among the factor I refer to differences between 100% (treatments C and BC) and 50% (treatments S and BS) irrigation. For the case of d-(−)-tagatofuranose, gluconolactone, d-glucose, d-(+)-galactose, d-(+)-turanose, and d-erythrose in Arbequina and d-(−)-tagatofuranose, d-glucose, d-(+)-galactose, d-(+)-turanose, d-erythrose, d-mannitol, and myo-inositol in Galega, one-way ANOVA was performed and significant differences (p ≤ 0.05) are marked in bold and indicated by different letters. d-(−)-Tagato.: d-(−)-Tagatofuranose; Gluconolac.: Gluconolactone; d-(+)-Galac.—d-(+)-Galactose; d-(+)-Turan.: d-(+)-Turanose.
Figure 6
Figure 6
Relative expression of dehydrins OeDHN1I (A,D), small heat shock proteins OeHSP18.3 (B,E), and aquaporins OePIP1.1 (C,F) in O. europaea plants of the treatments C (well-watered), BC (biostimulant + well-watered), S (water deficit), and BS (biostimulant + water deficit). Bars represents mean ± standard error (n = 4–8). The effect of the factor irrigation (I), factor biostimulant (B), and the interaction between the factor irrigation and biostimulant (I × B) are presented, and when the effect of each factor or the interaction is statistically significant (p ≤ 0.05), it appears in bold. Different letters indicate statistically significant difference (p ≤ 0.05). Significant differences among I × B refer to differences between C, BC, S, and BS treatments. Significant differences among the factor B refer to treatments without biostimulant (treatments C and S) and treatments with biostimulant (treatments BC and BS).
Figure 7
Figure 7
Principal component analysis plot (x-axis—first component PC1; and y-axis—second component PC2) of the physiological, molecular, and metabolomic data in olive leaves from both cultivars. PC1 explains 36% of the variance, while PC2 explain 23%. Circles with different colors depict sample scores of the different treatments. Ac.: acid; Carot.: carotenoids; DHN: OeDHN1; E: transpiration rate; Galacto.: d-galactose; Gluco.: d-Glucose; gs: stomatal conductance; Height: heigh increment; HSP: OeHSP18.3; LCA: long-chain alkane; Mio-In.: myo-inositol; Neophyt.: neophytadiene; PIP: OePIP1.1; Pn: net CO2-assimilation rate; Tagato.: d-(−)- Tagatofuranose; WUE: intrinsic water-use efficiency.
Figure 8
Figure 8
Schematization of the experiment. FC, field capacity.

Similar articles

Cited by

References

    1. Harris R.M.B., Loeffler F., Rumm A., Fischer C., Horchler P., Scholz M., Foeckler F., Henle K. Biological responses to extreme weather events are detectable but difficult to formally attribute to anthropogenic climate change. Sci. Rep. 2020;10:14067. doi: 10.1038/s41598-020-70901-6. - DOI - PMC - PubMed
    1. Fraga H., Moriondo M., Leolini L., Santos J.A. Mediterranean olive orchards under climate change: A review of future impacts and adaptation strategies. Agronomy. 2021;11:56. doi: 10.3390/agronomy11010056. - DOI
    1. Brito C., Dinis L.-T., Moutinho-Pereira J., Correia C.M. Drought stress effects and olive tree acclimation under a changing climate. Plants. 2019;8:232. doi: 10.3390/plants8070232. - DOI - PMC - PubMed
    1. Chaves M.M., Costa J.M., Zarrouk O., Pinheiro C., Lopes C.M., Pereira J.S. Controlling stomatal aperture in semi-arid regions—The dilemma of saving water or being cool? Plant Sci. 2016;251:54–64. doi: 10.1016/j.plantsci.2016.06.015. - DOI - PubMed
    1. Abdalla M., Ahmed M.A., Cai G., Wankmüller F., Schwartz N., Litig O., Javaux M., Carminati A. Stomatal closure during water deficit is controlled by below-ground hydraulics. Ann. Bot. 2022;129:161–170. doi: 10.1093/aob/mcab141. - DOI - PMC - PubMed

LinkOut - more resources