. 2024 Oct 5;17(10):1333.
doi: 10.3390/ph17101333.

The Identification of New Pharmacological Targets for the Treatment of Glaucoma: A Network Pharmacology Approach

Affiliations

The Identification of New Pharmacological Targets for the Treatment of Glaucoma: A Network Pharmacology Approach

Erika Giuffrida et al. Pharmaceuticals (Basel). .

Abstract

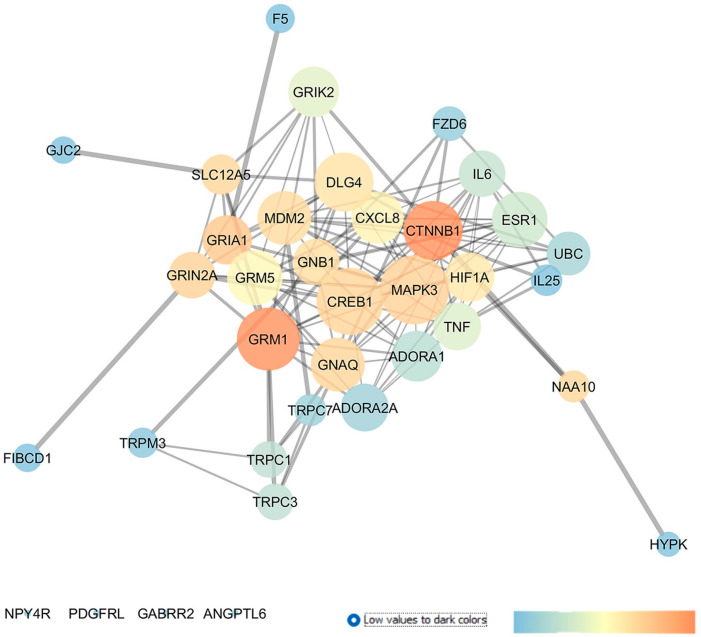
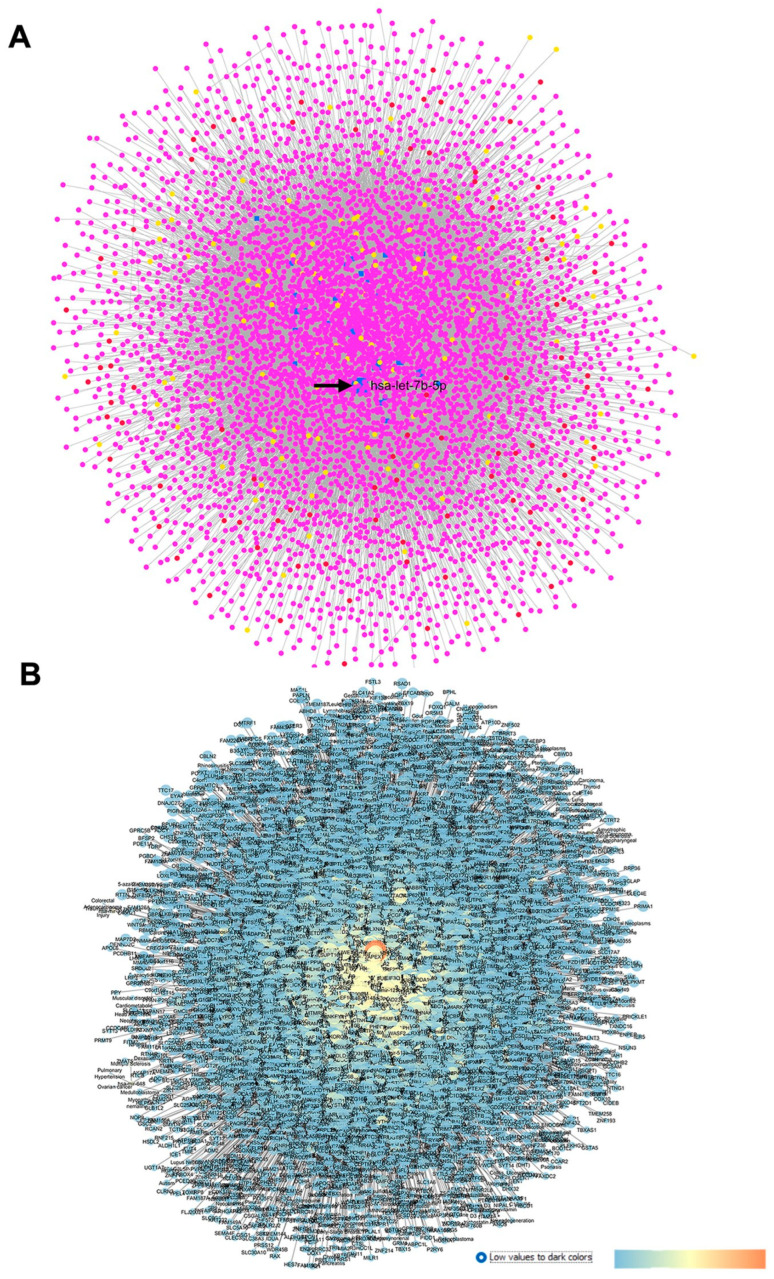
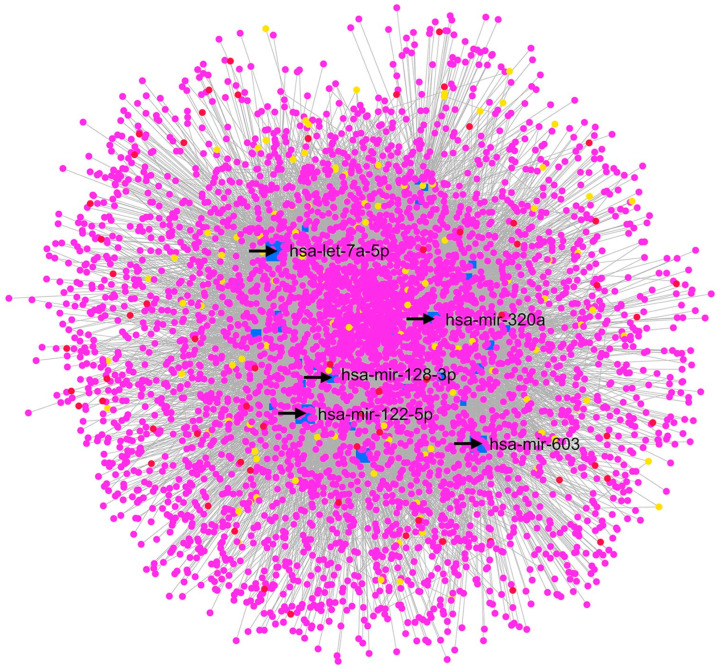
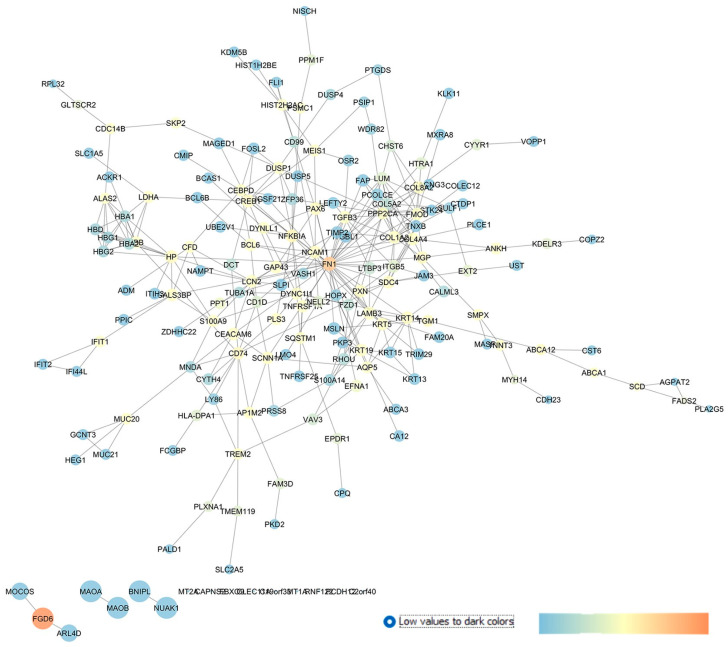
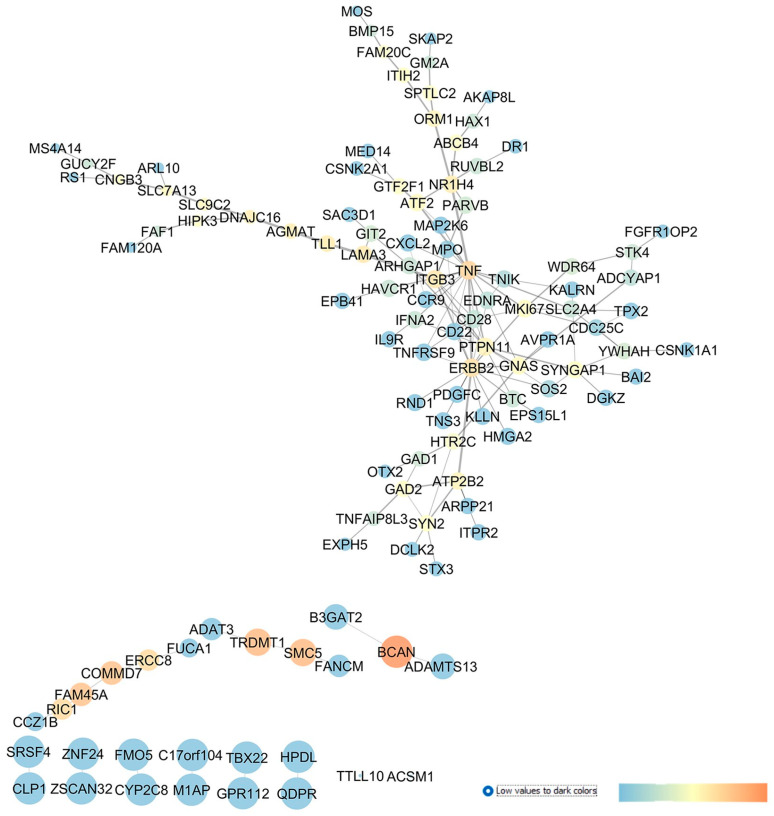
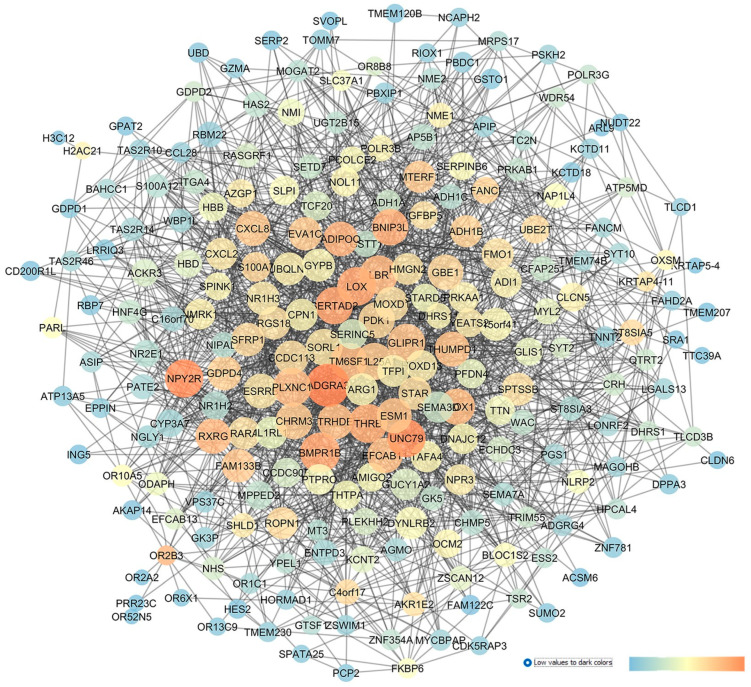
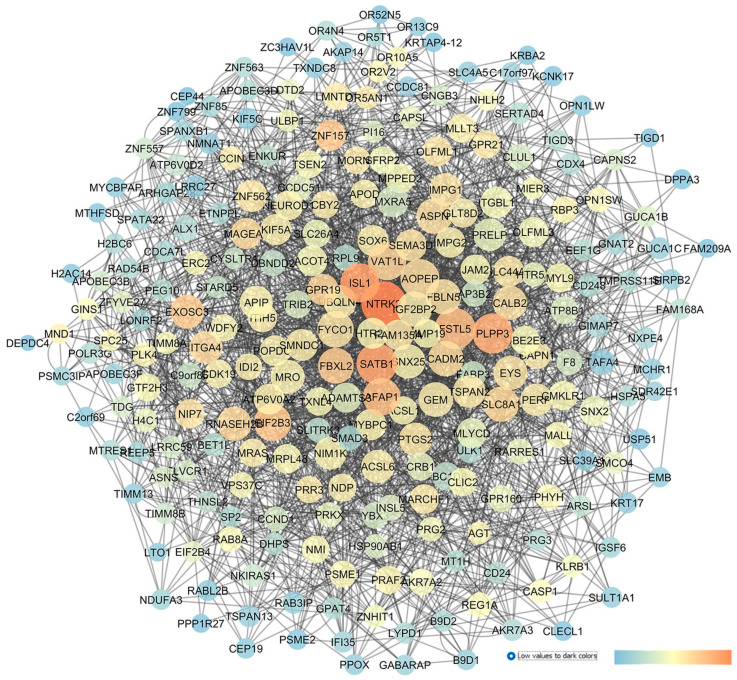
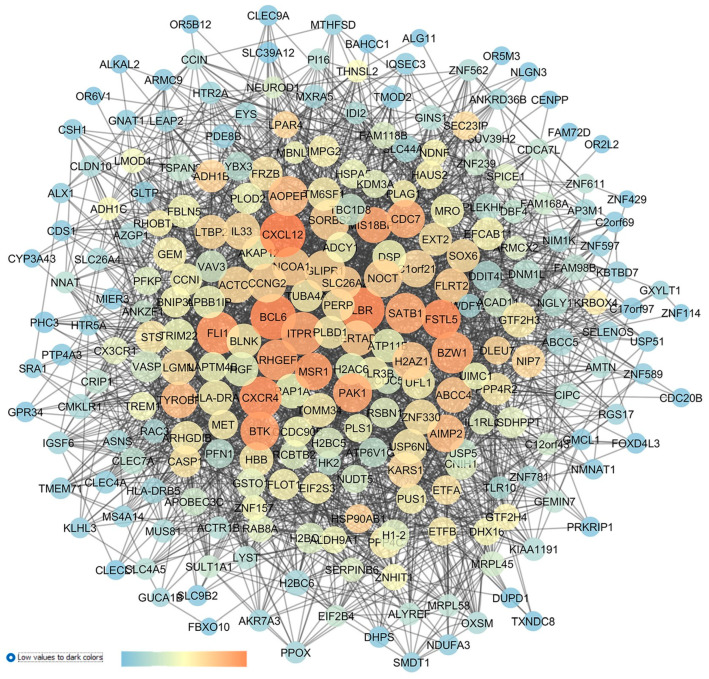
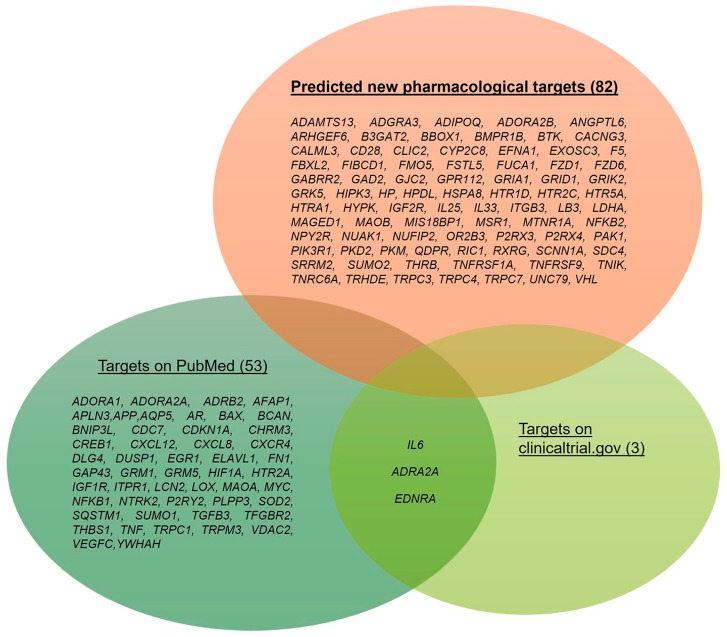
Background: Glaucoma is a progressive optic neuropathy characterized by the neurodegeneration and death of retinal ganglion cells (RGCs), leading to blindness. Current glaucoma interventions reduce intraocular pressure but do not address retinal neurodegeneration. In this effort, to identify new pharmacological targets for glaucoma management, we employed a network pharmacology approach. Methods: We first retrieved transcriptomic data from GEO, an NCBI database, and carried out GEO2R (an interactive web tool aimed at comparing two or more groups of samples in a GEO dataset). The GEO2R statistical analysis aimed at identifying the top differentially expressed genes (DEGs) and used these as input of STRING (Search Tool for the Retrieval of Interacting Genes/Proteins) app within Cytoscape software, which builds networks of proteins starting from input DEGs. Analyses of centrality metrics using Cytoscape were carried out to identify nodes (genes or proteins) involved in network stability. We also employed the web-server software MIRNET 2.0 to build miRNA-target interaction networks for a re-analysis of the GSE105269 dataset, which reports analyses of microRNA expressions. Results: The pharmacological targets, identified in silico through analyses of the centrality metrics carried out with Cytoscape, were rescored based on correlations with entries in the PubMed and clinicaltrials.gov databases. When there was no match (82 out of 135 identified central nodes, in 8 analyzed networks), targets were considered "potential innovative" targets for the treatment of glaucoma, after further validation studies. Conclusions: Several druggable targets, such as GPCRs (e.g., 5-hydroxytryptamine 5A (5-HT5A) and adenosine A2B receptors) and enzymes (e.g., lactate dehydrogenase A or monoamine oxidase B), were found to be rescored as "potential innovative" pharmacological targets for glaucoma treatment.

Keywords: computational systems biology; glaucoma; network pharmacology; neuroinflammation; pharmacological targets.


Conflict of interest statement

The authors declare that this research was conducted in the absence of any commercial or financial relationships that could be construed as a potential conflict of interest.

Figures

Figure 1
Figure 1
Dysregulated genes in retina of Lister Hooded rats 2 weeks after an optic nerve crush (ONC) injury. Network was analyzed with Cytoscape. Nodes are represented on the basis of closeness centrality values (node dimension) and betweenness centrality values, as shown by the legend of this figure (temperature color scale blue < red). Edge thickness is proportional to edge betweenness values.
Figure 2
Figure 2
GSE105269 network: primary open-angle vs. CTRL cataract patients. (A) Output of MIRNET network within the MIRNET environment. Magenta nodes correspond to genes, blue nodes to miRNAs, yellow nodes to compounds (predicted to be able to modulate miRNA expressions), and red nodes to diseases associated to miRNAs. The arrow indicates the has-let-7b-5p miRNA, i.e., the most central node of this network. (B) For the MIRNET-generated network represented within Cytoscape, centrality parameters are mapped as follows: closeness centrality is proportional to node dimension; betweenness centrality is represented with a temperature color scale (blue to red for increasing values, as shown by the legend of this figure); and edge betweenness is proportional to edge thickness.
Figure 3
Figure 3
GSE105269 MIRNET network, XFG vs. CTRL. The MIRNET web server provided miRNA–gene, miRNA–disease, and miRNA–small molecule interactions, depicted in this network. In this network, has-let-7a-5p, hsa-miR-122-5p, hsa-miR-320a, hsa-miR-128-3p, and hsa-miR-603 are the nodes with the highest centrality values. Magenta nodes correspond to genes, blue nodes to miRNAs, yellow nodes to compounds (predicted to be able to modulate miRNA expressions), and red nodes to diseases associated with miRNAs.
Figure 4
Figure 4
GSE27276 network describing the differences between the expression pattern of cultured trabecular meshwork cells in isolated tissues from POAG patients and healthy subjects. The network has been built with STRING app of Cytoscape, and the centrality parameters are mapped as follows: closeness centrality is proportional to node dimension, betweenness centrality is represented with a temperature color scale, and edge betweenness is proportional to edge thickness.
Figure 5
Figure 5
GSE4316 re-analysis and network building, comparing gene expression profile of TM control tissues vs. tissues isolated from POAG patients. In this network, analyzed in Cytoscape, nodes are represented on the basis of betweenness centrality values (color scale blue < red) and closeness centrality values (node dimension), and edge thickness is proportional to edge betweenness values.
Figure 6
Figure 6
GSE45570 network representing a comparison of the optic nerve head expression profiles of patients with ocular hypertension (without glaucoma) vs. CTRL subjects. This network was analyzed with Cytoscape: the node size is proportional to closeness centrality, the color node represents betweenness values ranging from blue to red (blue to red for increasing values), and edge thickness values are proportional to those of edge betweenness.
Figure 7
Figure 7
GSE45570 network describing a comparison of the optic nerve head expression profiles of patients with POAG vs. CTRL subjects. This network was analyzed with Cytoscape: the node size is proportional to closeness centrality, the color node represents betweenness values ranging from blue (low betweenness values) to red (high betweenness values), and edge thickness values are proportional to those of edge betweenness.
Figure 8
Figure 8
GSE45570 network representing the differences of the optic nerve head expression profiles of patients with POAG vs. patients with ocular hypertension (without glaucoma). This network was analyzed with Cytoscape: the node size is proportional to closeness centrality; the color node represents betweenness values, ranging from a blue to red of temperature color scale (shown in figure), with increasing values going from blue to red; and the edge thickness values are proportional to those of edge betweenness.
Figure 9
Figure 9
Set of dysregulated genes identified after our re-analyses of the GSE133563, GSE105269, GSE27276, GSE4316, GSE45570, and GSE3554 datasets. Genes that were already evaluated in clinical trials or preclinical studies are distinguished from those without a match in the PubMed and clinicaltrials.gov databases, i.e., predicted new pharmacological targets. The number of genes is shown in brackets.

Similar articles

Cited by

References

    1. GBD 2019 Blindness and Vision Impairment Collaborators. Vision Loss Expert Group of the Global Burden of Disease Study Causes of blindness and vision impairment in 2020 and trends over 30 years, and prevalence of avoidable blindness in relation to VISION 2020: The Right to Sight: An analysis for the Global Burden of Disease Study. Lancet Glob. Health. 2021;9:e144–e160. doi: 10.1016/S2214-109X(20)30489-7. - DOI - PMC - PubMed
    1. Mohan N., Chakrabarti A., Nazm N., Mehta R., Edward D.P. Newer advances in medical management of glaucoma. Indian J. Ophthalmol. 2022;70:1920–1930. doi: 10.4103/ijo.IJO_2239_21. - DOI - PMC - PubMed
    1. Weinreb R.N., Aung T., Medeiros F.A. The pathophysiology and treatment of glaucoma: A review. JAMA. 2014;311:1901–1911. doi: 10.1001/jama.2014.3192. - DOI - PMC - PubMed
    1. Chou T.-H., Musada G., Romano G., Bolton E., Porciatti V. Anesthetic Preconditioning as Endogenous Neuroprotection in Glaucoma. Int. J. Mol. Sci. 2018;19:237. doi: 10.3390/ijms19010237. - DOI - PMC - PubMed
    1. Almasieh M., Wilson A.M., Morquette B., Vargas J.L.C., Di Polo A. The molecular basis of retinal ganglion cell death in glaucoma. Prog. Retin. Eye Res. 2012;31:152–181. doi: 10.1016/j.preteyeres.2011.11.002. - DOI - PubMed

LinkOut - more resources