

Development of Anemometer Based on Inertial Sensor
- PMID: 39459060
- PMCID: PMC11509312
- DOI: 10.3390/mi15101186
Development of Anemometer Based on Inertial Sensor
Abstract
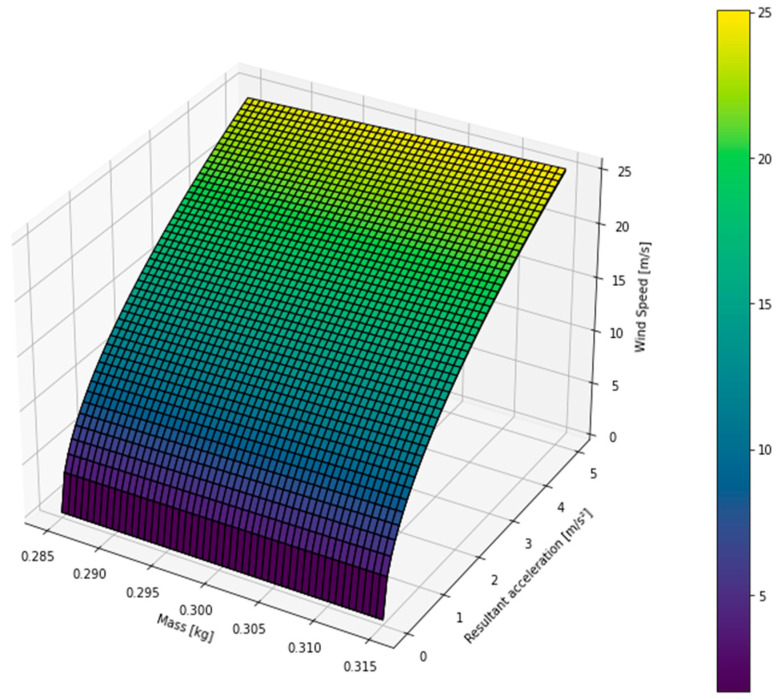
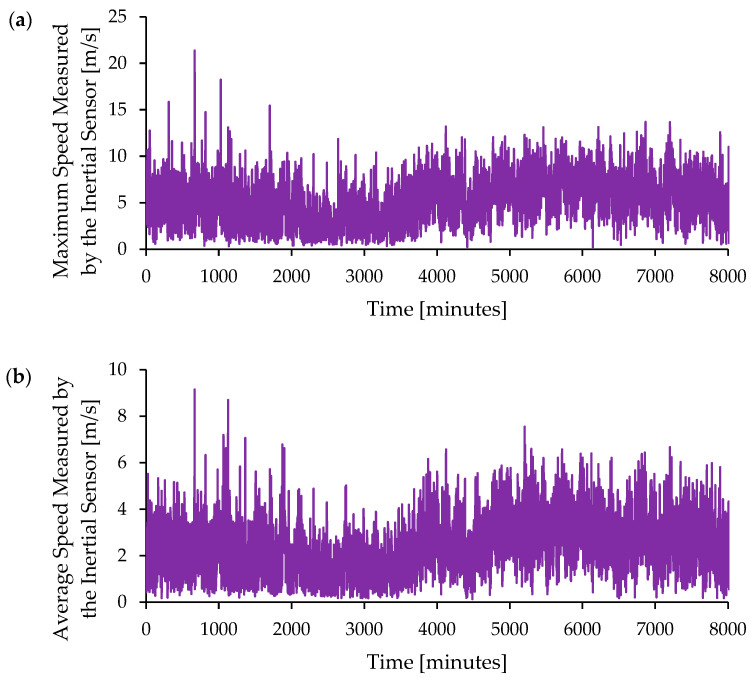
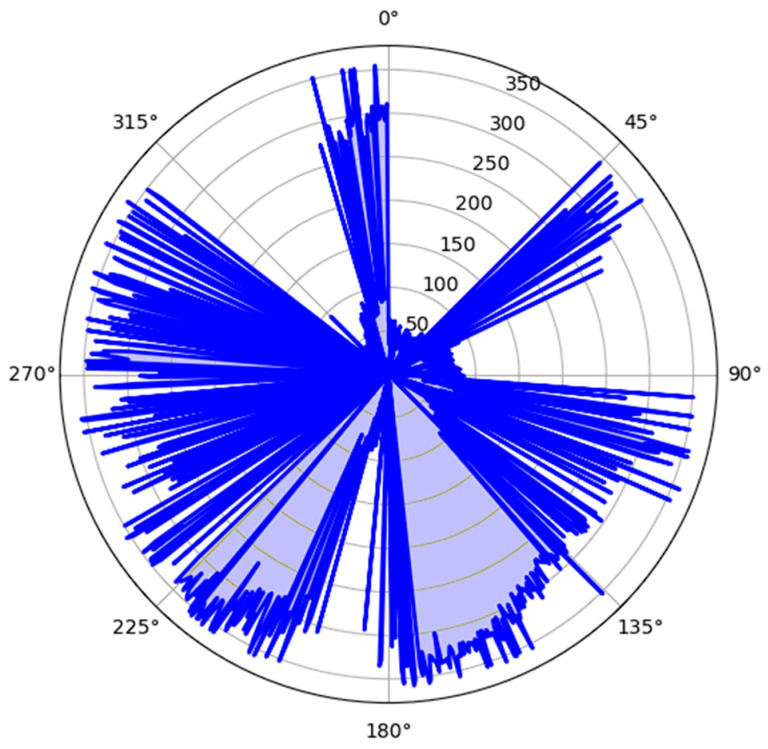
The current article elucidates a study centered on the development of an anemometer leveraging an inertial sensor for wind speed measurement in the northeast region of Brazil, focusing on renewable energy generation. The study encompassed a series of experiments aimed at calibrating the anemometer, analyzing the noise generated by the inertial sensor, and scrutinizing the data acquired during wind speed measurement. The calibration process unfolded in three stages: initial noise analysis, subsequent inertial data analysis, and the derivation of calibration curves. The first two stages involved experiments conducted at an average sampling rate of 10 Hz. Simultaneously, the third stage incorporated data collected over a 1 h duration while maintaining the same sampling rate. The outcomes underscore the suitability of the anemometer based on an inertial sensor for wind energy systems and diverse applications. While the wind readings from the prototype exhibit considerable fluctuations, a three-length moving average filter is applied to the prototype's output to mitigate these fluctuations. The calibration surface was established using observational data, and the resultant surface is detailed. Data analysis assumes paramount significance in wind speed measurement, and the K-NN algorithm demonstrated superior efficacy in estimating the correspondence between measured and control data.
Keywords: anemometer; calibration surface; inertial sensor; renewable energy generation; wind speed measurement.
Conflict of interest statement
The authors declare no conflicts of interest.
Figures
References
-
- Bermann C. Energia No Brasil, Para Que? Para Quem?: Crise e Alternativa Para Um País Sustentável. Livraria da Física; São Paulo, Brazil: 2002.
-
- Cavalcanti I.F.A. Tempo e Clima No Brasil. Oficina de Textos; São Paulo, Brazail: 2016.
-
- de Oliveira S.S., Souza E.P.D. Análise de Modelos de Mesoescala Para Caracterização Do Potencial Eólico Do Estado Da Paraíba. Rev. Bras. Meteorol. 2017;32:277–291. doi: 10.1590/0102-77863220009. - DOI
-
- Ferruzzi Y., Agrícola E., Ricieri R.P. The Instrument of Measuring the Speed of the Wind; Proceedings of the 5th Encontro de Energia no Meio Rural; Campinas, Brazil. 19–21 October 2004; p. 7.
Grants and funding
- https://doi.org/10.54499/2022.06841.PTDC/Fundação para a Ciência e Tecnologia
- https://doi.org/10.54499/2020.00828.CEECIND/CP1590/CT0004/Fundação para a Ciência e Tecnologia
- https://doi.org/10.54499/UIDB/04708/2020/Fundação para a Ciência e Tecnologia
- https://doi.org/10.54499/UIDP/04708/2020/Fundação para a Ciência e Tecnologia
LinkOut - more resources
Full Text Sources
