. 2024 Oct 18;29(20):4935.
doi: 10.3390/molecules29204935.

Molecular Dynamics (MD) Simulations Provide Insights into the Activation Mechanisms of 5-HT2A Receptors

Affiliations

Molecular Dynamics (MD) Simulations Provide Insights into the Activation Mechanisms of 5-HT2A Receptors

Meng Cui et al. Molecules. .

Abstract

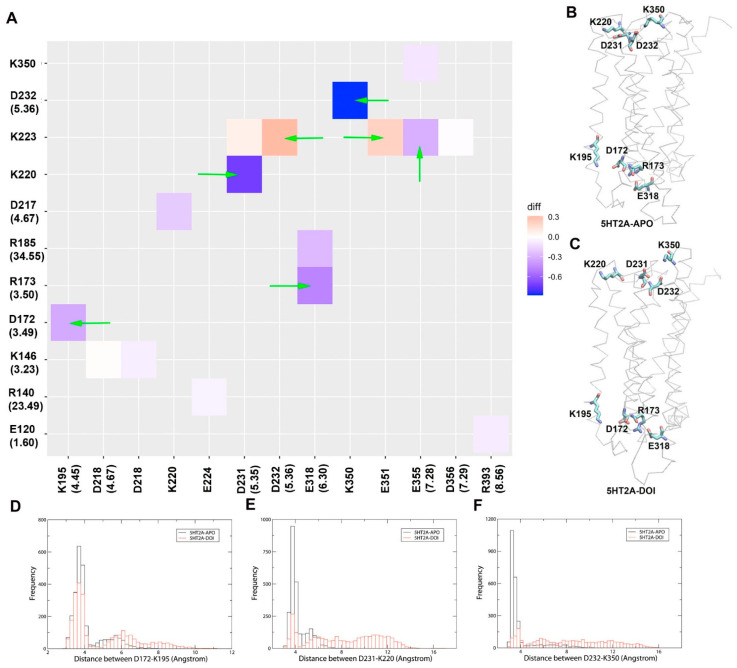
Recent breakthroughs in the determination of atomic resolution 3-D cryo-electron microscopy structures of membrane proteins present an unprecedented opportunity for drug discovery. Structure-based drug discovery utilizing in silico methods enables the study of dynamic connectivity of stable conformations induced by the drug in achieving its effect. With the ever-expanding computational power, simulations of this type reveal protein dynamics in the nano-, micro-, and even millisecond time scales. In the present study, aiming to characterize the protein dynamics of the 5HT2A receptor stimulated by ligands (agonist/antagonist), we performed 1 µs MD simulations on 5HT2A/DOI (agonist), 5HT2A/GSK215083 (antagonist), and 5HT2A (APO, no ligand) systems. The crystal structure of 5HT2A/zotepine (antagonist) (PDB: 6A94) was used to set up the simulation systems in a lipid bilayer environment. We found the monitoring of the ionic lock residue pair (R3.50-E6.30) of 5HT2A in MD simulations to be a good approximation of the effects of agonists (ionic lock breakage) or antagonists (ionic lock formation) on receptor activation. We further performed analyses of the MD trajectories, including Principal Component Analysis (PCA), hydrogen bond, salt bridge, and hydrophobic interaction network analyses, and correlation between residues to identify key elements of receptor activation. Our results suggest that in order to trigger receptor activation, DOI must interact with 5HT2A through residues V5.39, G5.42, S5.43, and S5.46 on TM5, inducing significant conformational changes in the backbone angles of G5.42 and S5.43. DOI also interacted with residues W6.48 (toggle switch) and F6.51 on TM6, causing major conformational shifts in the backbone angles of F6.44 and V6.45. These structural changes were transmitted to the intracellular ends of TM5, TM6, and ICL3, resulting in the breaking of the ionic lock and subsequent G protein activation. The studies could be helpful in future design of selective agonists/antagonists for various serotonin receptors (5HT1A, 5HT2A, 5HT2B, 5HT2C, and 5HT7) involved in detrimental disorders, such as addiction and schizophrenia.

Keywords: 5HT2A receptor; G-protein-coupled receptor (GPCR); MD simulations; conformational changes; protein−ligand interactions; receptor activation.


Conflict of interest statement

The authors declare no conflict of interest.

Figures

Figure 1
Figure 1
MD simulations on 5HT2A−APO, 5HT2A−DOI, and 5HT2A−GSK215083 for 1 μs. (A) Docked 5HT2A−DOI; (B) 5HT2A−GSK215083 complex structures. (C) RMSD of Cα atoms of the receptor for the three systems as a function of simulation time (ns). (D) Ionic lock distances of the receptors as a function of simulation time (ns). (E) Histogram of (D,F) representative snapshots showing ion lock formed in 5HT2A/GSK215803 and broken in 5HT2A/DOI.
Figure 2
Figure 2
The binding site residues in 5HT2A receptor interact with DOI and GSK215803. (A) percentage contacts of the binding site residues in 5HT2A interactions with GSK215803 and DOI during MD simulations (200–1000 ns). (B,C) 2D ligand−receptor interaction plots for DOI and GSK215803, respectively. Both snapshots were taken from the last frames of the simulations (at 1 µs).
Figure 3
Figure 3
Root mean square fluctuations (RMSF) of the Cα atoms of 5HT2A/APO, 5HT2A/DOI, and 5HT2A/GSK215803 based on the MD simulations (200–1000 ns).
Figure 4
Figure 4
The first and second eigenvectors (EVs) from combined Principal Component Analysis (PCA) of 5HT2A−APO/DOI based on the MD simulations (200–1000 ns; Cα atoms of the receptor). The 5HT2A receptor structures were shown as Cα traces (six frames colored from red to blue).
Figure 5
Figure 5
Phi/psi angle distributions of the residues F6.44 and V6.45 in the TM6 for 5HT2A/APO, 5HT2A/GSK215803, and 5HT2A/DOI (200–1000 ns). (A) The average phi/psi angles for the APO system were (−69.76/−34.26; −65.33/−39.75), the average phi/psi angles for the GSK215803-bound system were (−59.83/−47.54; −61.38/−47.59), and the average phi/psi angles for the DOI-bound system were (−70.88/−36.11; −89.08/−32.69). (B) TM6 conformation comparison between 5HT2A/APO (blue) and 5HT2A/DOI (red) at 200 ns (left) and 1000 ns (right) during MD simulations.
Figure 6
Figure 6
Comparison of key salt bridge interactions between 5HT2A−APO and 5HT2A−DOI based on MD simulations (200–1000 ns). (A) Heatmap plot of salt bridge pairs (red: salt bridge formed; blue: salt bridge disrupted in 5HT2A/DOI system). (B) The key salt bridge residues in 5HT2A−APO and 5HT2A−DOI. (CF) Histograms of distributions for the distance between D172-K195, D231-K220, and D232-K350, respectively. Green arrows point to the residue pairs shown in (B,C).
Figure 7
Figure 7
Comparison of hydrogen bond networks between 5HT2A/APO and 5HT2A/DOI. (A) Heatmap plot of hydrogen bond pairs (red: hydrogen bond formed; blue: hydrogen bond disrupted in the 5HT2A/DOI system). (B) Hydrogen bond formed in the 5HT2A/APO system (blue in panel (A)). (C) Hydrogen bond formed in the 5HT2A/DOI system (red in panel (A)). Green arrows point to the residue pairs shown in (B,C).
Figure 8
Figure 8
Selected hydrophobic interaction pairs formed in the 5HT2A/DOI system but absent in the 5HT2A/APO system, which were L45.52-L4.65 (0.46), L45.52-I3.29 (0.45), V6.59-N5.37(0.95), F6.51-V5.39(0.98), S5.46-I4.56 (0.51), V6.45-F5.47(0.46), F6.41-I3.46(0.68), Y7.53-F6.44 (0.44), L7.55-L6.43(0.68), and F7.56-V6.40(0.85). The 5HT2A was drawn in Cα trace, DOI was drawn in vdw spheres, and residues were drawn in sticks.
Figure 9
Figure 9
Residue correlation difference between 5HT2A/DOI and 5HT2A. (A) Anti-correlated motions. (B) Correlated motions.

References

    1. Rosenbaum D.M., Rasmussen S.G., Kobilka B.K. The structure and function of G-protein-coupled receptors. Nature. 2009;459:356–363. doi: 10.1038/nature08144. - DOI - PMC - PubMed
    1. Hu G.M., Mai T.L., Chen C.M. Visualizing the GPCR Network: Classification and Evolution. Sci. Rep. 2017;7:15495. doi: 10.1038/s41598-017-15707-9. - DOI - PMC - PubMed
    1. Hauser A.S., Chavali S., Masuho I., Jahn L.J., Martemyanov K.A., Gloriam D.E., Babu M.M. Pharmacogenomics of GPCR Drug Targets. Cell. 2018;172:41–54.e19. doi: 10.1016/j.cell.2017.11.033. - DOI - PMC - PubMed
    1. Palczewski K., Kumasaka T., Hori T., Behnke C.A., Motoshima H., Fox B.A., Le Trong I., Teller D.C., Okada T., Stenkamp R.E., et al. Crystal structure of rhodopsin: A G protein-coupled receptor. Science. 2000;289:739–745. doi: 10.1126/science.289.5480.739. - DOI - PubMed
    1. Park J.H., Scheerer P., Hofmann K.P., Choe H.W., Ernst O.P. Crystal structure of the ligand-free G-protein-coupled receptor opsin. Nature. 2008;454:183–187. doi: 10.1038/nature07063. - DOI - PubMed

MeSH terms

LinkOut - more resources