Comparative Study
. 2024 Sep 27;16(10):1534.
doi: 10.3390/v16101534.

Comparison of Chikungunya Virus-Induced Disease Progression and Pathogenesis in Type-I Interferon Receptor-Deficient Mice (A129) and Two Wild-Type (129Sv/Ev and C57BL/6) Mouse Strains

Affiliations
Comparative Study

Comparison of Chikungunya Virus-Induced Disease Progression and Pathogenesis in Type-I Interferon Receptor-Deficient Mice (A129) and Two Wild-Type (129Sv/Ev and C57BL/6) Mouse Strains

Victoria A Graham et al. Viruses. .

Abstract

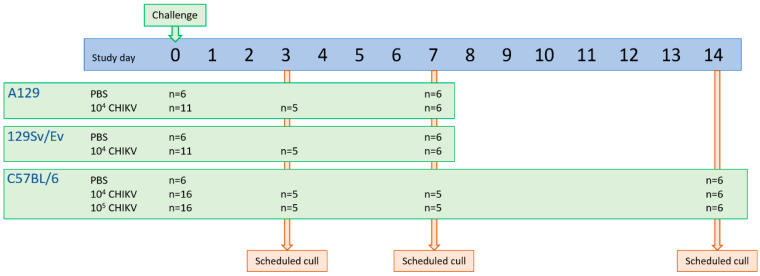
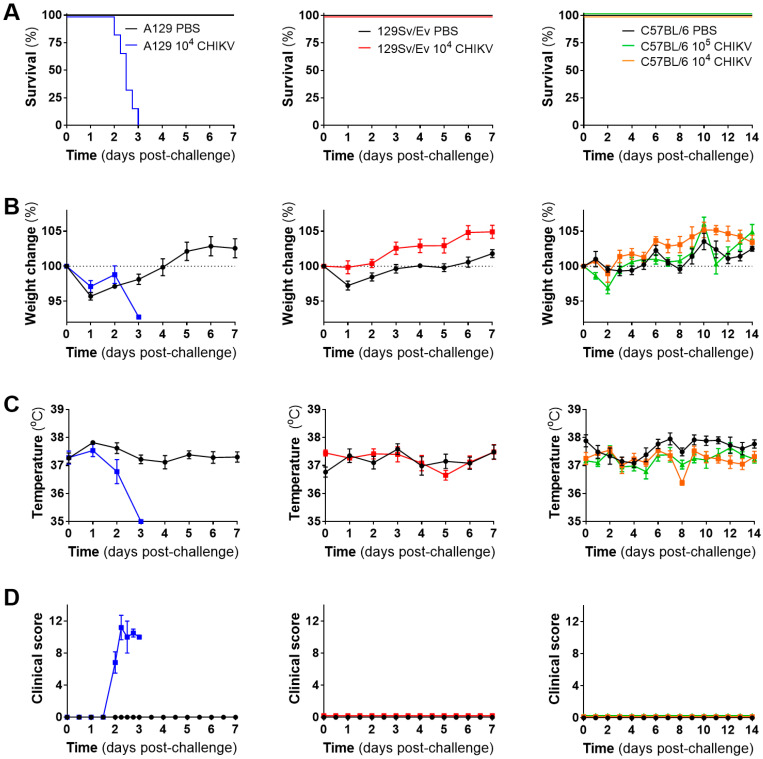
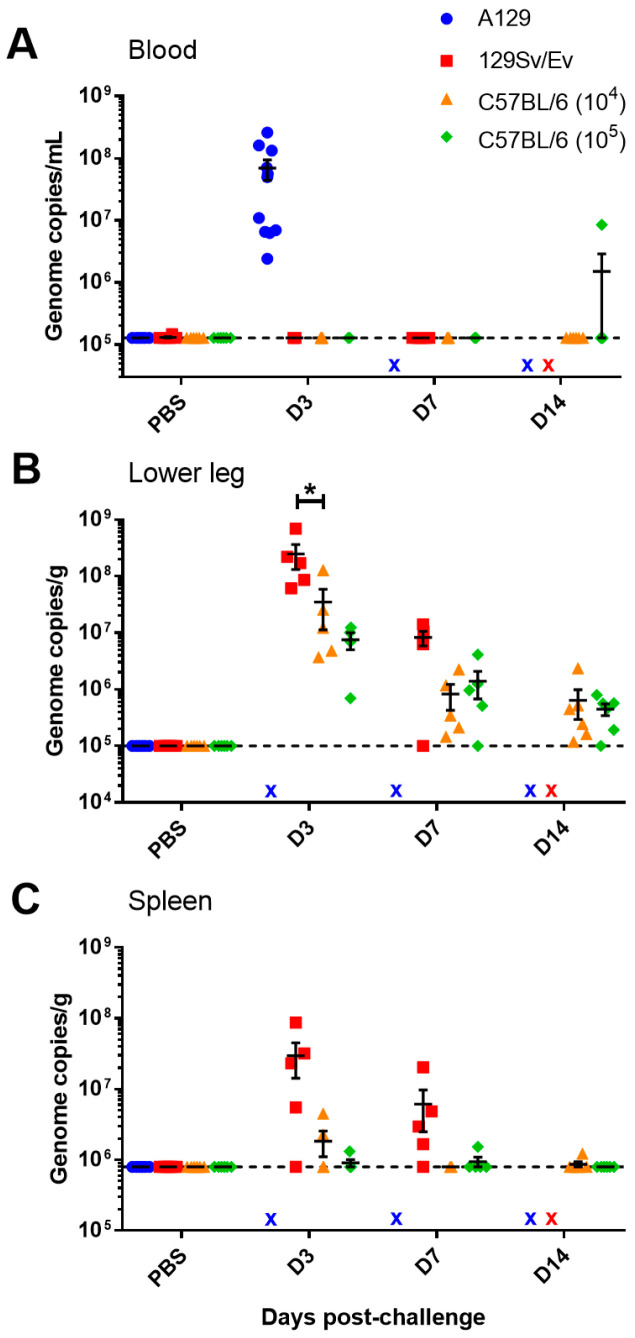
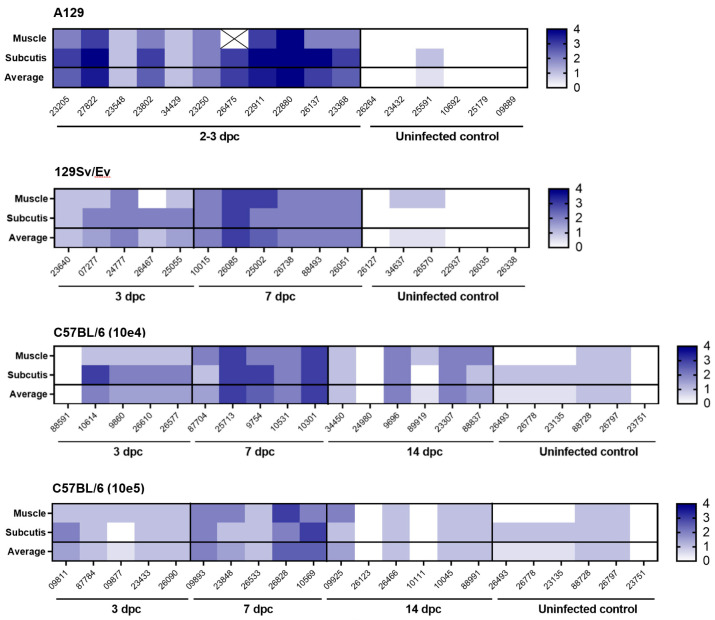
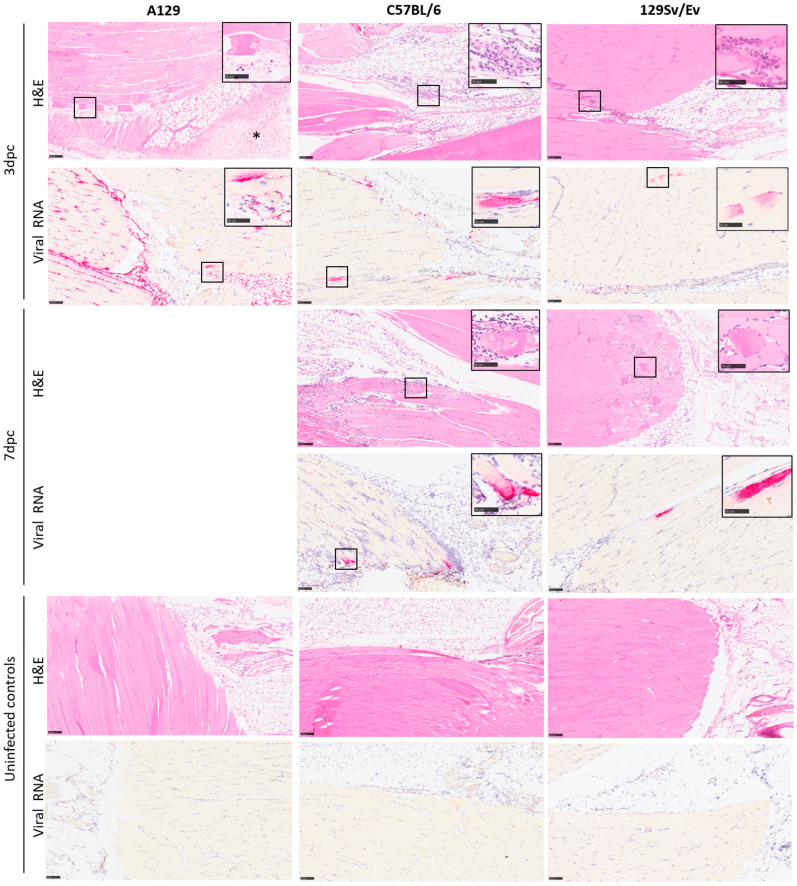
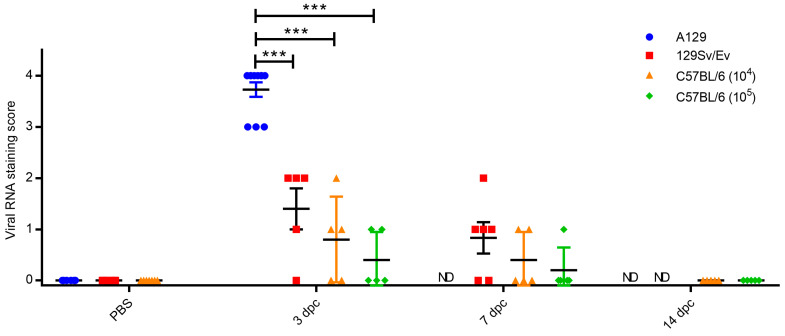
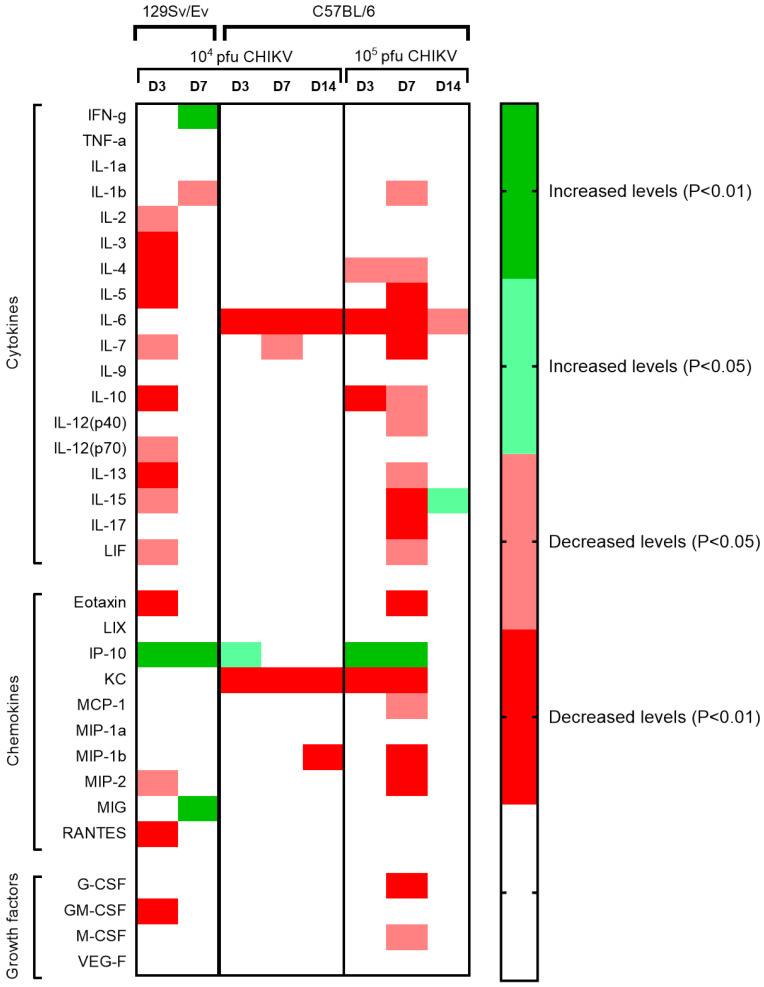
Chikungunya virus (CHIKV) is a mosquito-borne alphavirus causing a debilitating febrile illness with rheumatic disease symptoms of arthralgia and arthritis. Since its spread outside of Africa in 2005, it continues to cause outbreaks and disseminates into new territories. Intervention strategies are urgently required, including vaccination and antiviral approaches. To test efficacy, the use of small animal models is required. Two mouse strains, A129, with a deficiency in their type-I interferon (IFN) receptor, and C57BL/6 are widely used. A direct comparison of these strains alongside the wild-type parental strain of the A129 mice, 129Sv/Ev, was undertaken to assess clinical disease progression, viral loads in key tissues, histological changes and levels of sera biomarkers. Our results confirm the severe disease course in A129 mice which was not observed in the parental 129Sv/Ev strain. Of the two wild-type strains, viral loads were higher in 129Sv/Ev mice compared to C57BL/6 counterparts. Our results have established these models and parameters for the future testing of vaccines and antiviral approaches.

Keywords: Chikungunya; model; mouse; pathogenesis; preclinical.


Conflict of interest statement

The authors declare no conflicts of interest. The funders had no role in the design of the study; in the collection, analyses, or interpretation of data; in the writing of the manuscript; or in the decision to publish the results.

Figures

Figure 1
Figure 1
Schematic overview of study design assessing CHIKV infection in three mouse strains.
Figure 2
Figure 2
Clinical outcomes of mice challenged with CHIKV. (A) Kaplan–Meier survival plots, (B) weight changes compared to the day of challenge, (C) body temperature and (D) clinical scores. Lines show mean values with error bars denoting standard error. Results are shown from n = 6 animals per group pre-allocated for monitoring of clinical course for up to 7 days (A129 and 129Sv/Ev) or 14 days (C57BL/6) post-challenge.
Figure 3
Figure 3
Viral RNA levels in blood and tissues from CHIKV-challenged mice measured by RT-PCR. Levels in the (A) blood expressed as genome copies per mL, and levels in the (B) lower hindlimb and (C) spleen expressed as genome copies per g. x, indicates samples not available. *, p < 0.05. Symbols show results from individual animals with line and whisker plots denoting mean and standard error.
Figure 4
Figure 4
Heatmap illustrating the severity of microscopic changes in muscle and subcutaneous tissue (subcutis) of the hindlimb in individual animals from mouse strains A129, 129SvEv and C57BL/6. Values indicate individual and average severity scores (muscle and subcutis). Cross symbol indicates sample not available.
Figure 5
Figure 5
Representative images illustrating the type and severity of microscopic changes, and the presence of viral RNA staining, in the skeletal muscle and subcutis of the hindlimb from A129, C57BL/6 and 129Sv/Ev mouse strains at 3 and 7 days after challenge with 104 pfu CHIKV, alongside uninfected controls. The changes comprise skeletal myocyte degeneration and loss, variably associated with a mainly neutrophilic cell infiltration and inflammation of the subcutis with oedema and haemorrhage and concomitant infiltrating inflammatory cells (indicated by an asterisk). These changes are more apparent in the A129 mice at 3 days post-challenge (left column, row 1) compared to C57BL/6 and 129Sv/Ev mouse strains at the same timepoint (middle and right columns, row 1). Viral staining is noted in all three strains (left, middle and right columns, row 2), and most prominent in A129 mice (left column, row 2). At 7 days post-challenge, there is a comparable increase in severity of changes in the C57BL/6 and 129Sv/Ev mouse strains (middle and right columns, rows 3 and 4) and low-level viral staining (middle and right columns, rows 4 and 5). Microscopic and changes and viral staining are absent in the uninfected control animals (left, middle and right columns, rows 5 and 6). Inset, higher power images of changes are highlighted in square boxes. Scale bars represent 100 μm in the main images and 50 μm in the insets. H&E, ISH.
Figure 6
Figure 6
Levels of RNAscope staining in the muscle and subcutis of the hindlimb. PBS group are unchallenged animals whereas other groups were challenged with CHIKV and culled at 3, 7 and 14 days post-challenge (dpc). ND, not done due to animals meeting humane endpoints beforehand (A129) or not planned as part of the study schedule. Symbols show results from individual animals with line and whisker plots denoting mean and standard error. ***, p < 0.001.
Figure 7
Figure 7
Heatmap showing statistically significant changes in cytokine, chemokine and growth factor serum concentrations in CHIKV-challenged animals compared to PBS mock-challenged strain-matched control animals (n = 6). Uncoloured areas represent no significance observed (p > 0.05).
Figure 8
Figure 8
Concentrations of a subset of analytes demonstrating significant differences after challenge with CHIKV. Results show levels of (A) IFN-γ, (B) IP-10, (C) KC and (D) MIG. Bars represent the mean values with error bars denoting standard error and results from individual animals identified as coloured dots. *, p < 0.05; **, p < 0.01.

References

    1. Strauss J.H., Strauss E.G. The alphaviruses: Gene expression, replication, and evolution. Microbiol. Rev. 1994;58:491–562. doi: 10.1128/mr.58.3.491-562.1994. - DOI - PMC - PubMed
    1. Lumsden W.H. An epidemic of virus disease in Southern Province, Tanganyika Territory, in 1952-53. II. General description and epidemiology. Trans. R. Soc. Trop. Med. Hyg. 1955;49:33–57. doi: 10.1016/0035-9203(55)90081-X. - DOI - PubMed
    1. Robinson M.C. An epidemic of virus disease in Southern Province, Tanganyika Territory, in 1952-53. I. Clinical features. Trans. R. Soc. Trop. Med. Hyg. 1955;49:28–32. doi: 10.1016/0035-9203(55)90080-8. - DOI - PubMed
    1. Chretien J.P., Anyamba A., Bedno S.A., Breiman R.F., Sang R., Sergon K., Powers A.M., Onyango C.O., Small J., Tucker C.J., et al. Drought-associated chikungunya emergence along coastal East Africa. Am. J. Trop. Med. Hyg. 2007;76:405–407. doi: 10.4269/ajtmh.2007.76.405. - DOI - PubMed
    1. Tsetsarkin K.A., Vanlandingham D.L., McGee C.E., Higgs S. A single mutation in chikungunya virus affects vector specificity and epidemic potential. PLoS Pathog. 2007;3:e201. doi: 10.1371/journal.ppat.0030201. - DOI - PMC - PubMed

Publication types

Substances

Grants and funding

LinkOut - more resources